
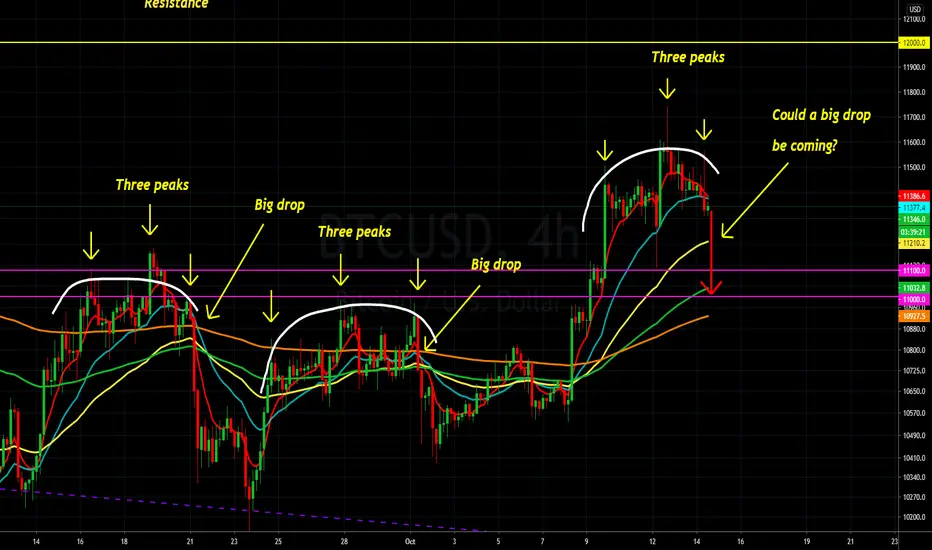
I'm seeing a repeating pattern in bitcoins price action. This chart is the 4 hour time frame but I also see a similar pattern on the daily which spanned the whole month of August. The pattern consists of three peaks that form a sort of dome pattern with the highest peak in the middle. As this latest pattern completes I am wondering whether it will also conclude with a large pull back. Not earth shattering analysis but just a pattern that to me looks like bitcoin keeps repeating lately.

Note
Okay, maybe this latest peak is the real third peak. 
Clause de non-responsabilité
Les informations et publications ne sont pas destinées à être, et ne constituent pas, des conseils ou recommandations financiers, d'investissement, de trading ou autres fournis ou approuvés par TradingView. Pour en savoir plus, consultez les Conditions d'utilisation.
Clause de non-responsabilité
Les informations et publications ne sont pas destinées à être, et ne constituent pas, des conseils ou recommandations financiers, d'investissement, de trading ou autres fournis ou approuvés par TradingView. Pour en savoir plus, consultez les Conditions d'utilisation.