
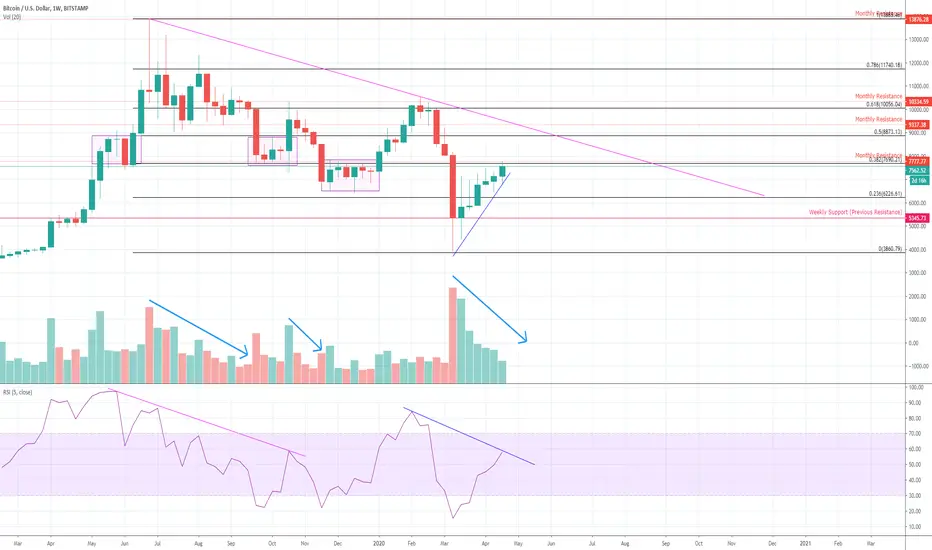
In recent pass there were turns at strong monthly resistance levels June 2019 - $13800 Level & Feb 202 - $10500 Level
Mid March expected support was at $7777 level. However covid19 crash brought in new yearly low, while weekly support level of $5340 was respected.
For last 6 weeks we see up trending weekly candles with selling pressure being high on 4 weeks, while last week and this showing some increased buying pressure, Disturbing part is reducing volume week by week, which signals bearish movement.
RSI is also showing divergence formation , however HTF are not my favorite for divergence.
Currently price is trying to break through a key monthly resistance which is key Fibonacci level for recent retracement. Last time it took 6 weeks to break through this level (Nov/Dec 2019)
If current week closes above, resistance level with a good volume I'll be bullish, otherwise bearish.
Mid March expected support was at $7777 level. However covid19 crash brought in new yearly low, while weekly support level of $5340 was respected.
For last 6 weeks we see up trending weekly candles with selling pressure being high on 4 weeks, while last week and this showing some increased buying pressure, Disturbing part is reducing volume week by week, which signals bearish movement.
RSI is also showing divergence formation , however HTF are not my favorite for divergence.
Currently price is trying to break through a key monthly resistance which is key Fibonacci level for recent retracement. Last time it took 6 weeks to break through this level (Nov/Dec 2019)
If current week closes above, resistance level with a good volume I'll be bullish, otherwise bearish.

Learn! Invest! Earn!
Clause de non-responsabilité
Les informations et publications ne sont pas destinées à être, et ne constituent pas, des conseils ou recommandations financiers, d'investissement, de trading ou autres fournis ou approuvés par TradingView. Pour en savoir plus, consultez les Conditions d'utilisation.
Learn! Invest! Earn!
Clause de non-responsabilité
Les informations et publications ne sont pas destinées à être, et ne constituent pas, des conseils ou recommandations financiers, d'investissement, de trading ou autres fournis ou approuvés par TradingView. Pour en savoir plus, consultez les Conditions d'utilisation.