
Chart Overview
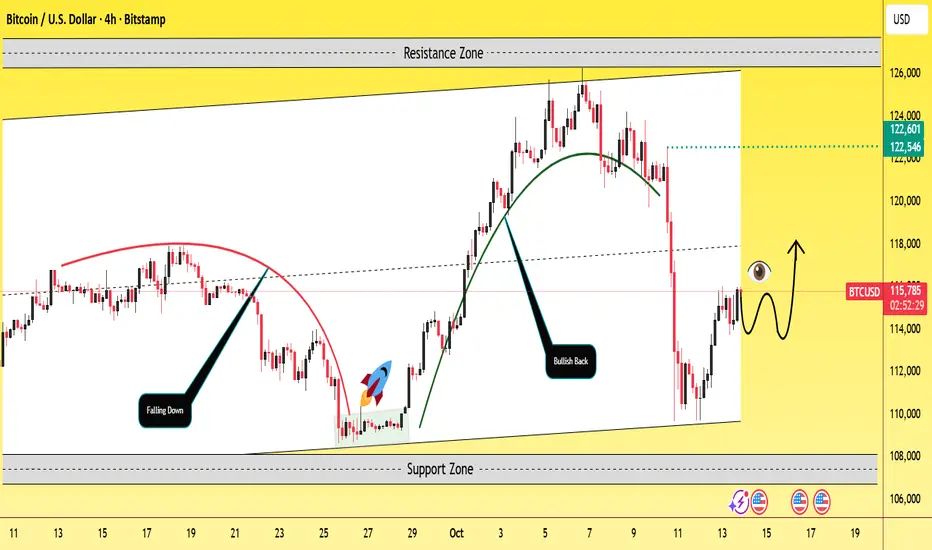
The chart shows Bitcoin trading between a strong support zone near $108,000–$112,000 and a resistance zone around $122,000–$123,000. After a sharp decline (“Falling Down”), BTC rebounded with a clear “Bullish Back” movement before facing resistance again.
Key Observations
1. Support Zone (108K–112K USD):
BTC has tested this zone multiple times, confirming strong buyer interest.
The recent bounce suggests accumulation pressure is building.
2. Resistance Zone (122K–123K USD):
Price faced rejection from this level previously.
A break and close above this resistance would confirm a bullish continuation pattern.
3. Pattern Formation:
A potential rounded bottom / cup shape appears to be forming, indicating bullish reversal potential.
The “eye” and “arrow” symbol in the chart highlight market observation before a possible breakout attempt.
4. Short-Term Outlook:
Expect sideways consolidation between 112K–118K USD before a possible bullish leg higher.
The next target levels on breakout: 120K, then 122.5K.
Support retest below 112K could delay recovery.
Bullish Scenario
Price holds above 115K and pushes past 118K, signaling momentum for a breakout.
Confirmation above 122.5K could open room toward 125K–128K.
The chart shows Bitcoin trading between a strong support zone near $108,000–$112,000 and a resistance zone around $122,000–$123,000. After a sharp decline (“Falling Down”), BTC rebounded with a clear “Bullish Back” movement before facing resistance again.
Key Observations
1. Support Zone (108K–112K USD):
BTC has tested this zone multiple times, confirming strong buyer interest.
The recent bounce suggests accumulation pressure is building.
2. Resistance Zone (122K–123K USD):
Price faced rejection from this level previously.
A break and close above this resistance would confirm a bullish continuation pattern.
3. Pattern Formation:
A potential rounded bottom / cup shape appears to be forming, indicating bullish reversal potential.
The “eye” and “arrow” symbol in the chart highlight market observation before a possible breakout attempt.
4. Short-Term Outlook:
Expect sideways consolidation between 112K–118K USD before a possible bullish leg higher.
The next target levels on breakout: 120K, then 122.5K.
Support retest below 112K could delay recovery.
Bullish Scenario
Price holds above 115K and pushes past 118K, signaling momentum for a breakout.
Confirmation above 122.5K could open room toward 125K–128K.

Clause de non-responsabilité
Les informations et publications ne sont pas destinées à être, et ne constituent pas, des conseils ou recommandations financiers, d'investissement, de trading ou autres fournis ou approuvés par TradingView. Pour en savoir plus, consultez les Conditions d'utilisation.
Clause de non-responsabilité
Les informations et publications ne sont pas destinées à être, et ne constituent pas, des conseils ou recommandations financiers, d'investissement, de trading ou autres fournis ou approuvés par TradingView. Pour en savoir plus, consultez les Conditions d'utilisation.