
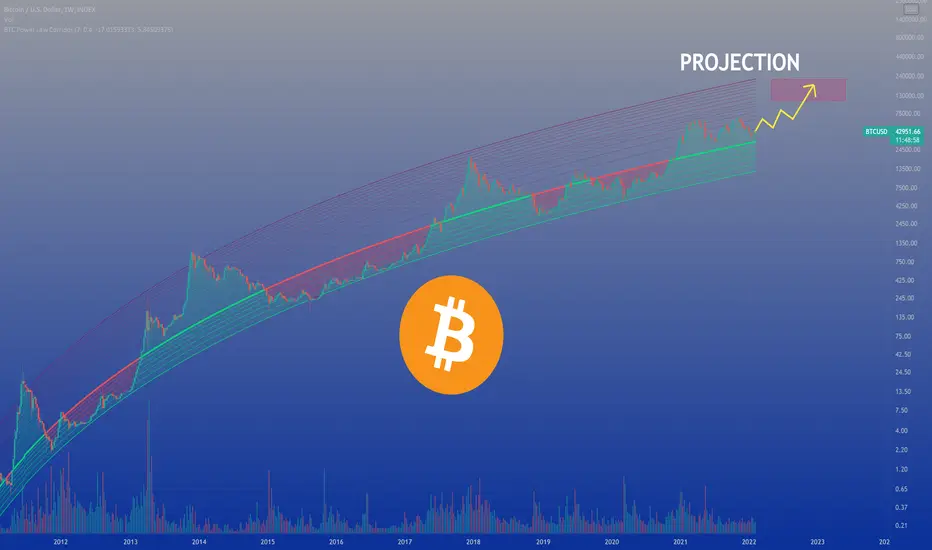
Hello Everyone, MrBanker is here. Today I present you a possible road to 200k for bitcoin. This chart shows multiple logarithmic-regression lines created from price-action data back from 2009.
- The middle bold line indicates the fair value for bitcoin.
- The lower part of this line is the undervalued bitcoin; indicating a possible accumulation zone.
- The higher part of the line is the overvalued zone; indicating a possible distribution phase.
During the latest Bull run in 2021, the price soared too fast for the price to reach higher logarithmic regression bands.
Currently, the price is trading in a sideways movement which shows a balance between bears and bulls.
As soon as the price reaches the 60-70k range back again, the media attention will be followed by a euphoric demand for bitcoin which will eventually push the price well over 100k+.
During that time, take your profit in small proportions.
Trade Safe,
MrBanker
- The middle bold line indicates the fair value for bitcoin.
- The lower part of this line is the undervalued bitcoin; indicating a possible accumulation zone.
- The higher part of the line is the overvalued zone; indicating a possible distribution phase.
During the latest Bull run in 2021, the price soared too fast for the price to reach higher logarithmic regression bands.
Currently, the price is trading in a sideways movement which shows a balance between bears and bulls.
As soon as the price reaches the 60-70k range back again, the media attention will be followed by a euphoric demand for bitcoin which will eventually push the price well over 100k+.
During that time, take your profit in small proportions.
Trade Safe,
MrBanker
Ordre annulé

Publications connexes
Clause de non-responsabilité
Les informations et publications ne sont pas destinées à être, et ne constituent pas, des conseils ou recommandations financiers, d'investissement, de trading ou autres fournis ou approuvés par TradingView. Pour en savoir plus, consultez les Conditions d'utilisation.
Publications connexes
Clause de non-responsabilité
Les informations et publications ne sont pas destinées à être, et ne constituent pas, des conseils ou recommandations financiers, d'investissement, de trading ou autres fournis ou approuvés par TradingView. Pour en savoir plus, consultez les Conditions d'utilisation.