
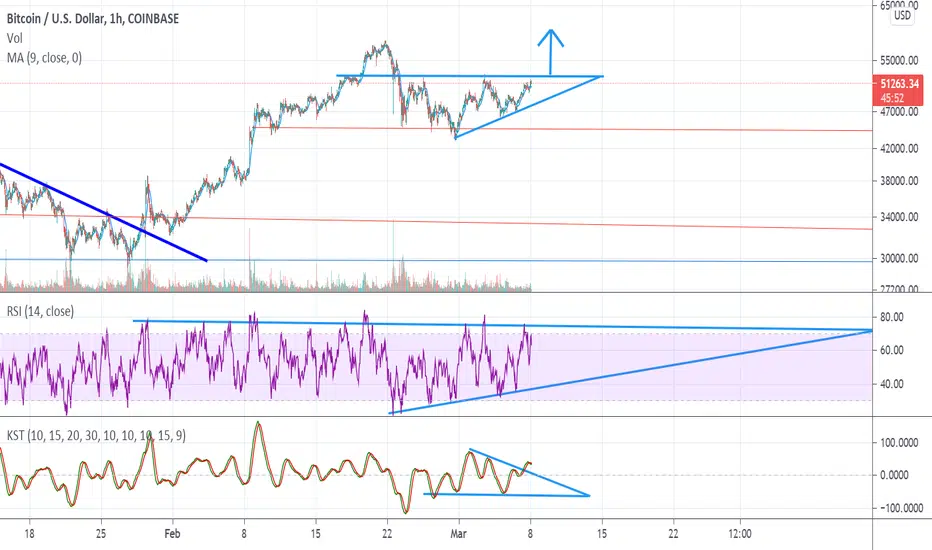
After breaking out from a crude bullish flag or what could have been considered a descending triangle linked to this post, BTC has consolidated into an Ascending Triangle drawn in light blue.
On the RSI there is a similar pattern as the price action, notice the series of higher lows along with the blue upward sloping support of the Ascending Triangle.
On the KST there's been a breakout of potentially a bullish flag pattern on a macro level, on a micro time frame there's been a bearish cross displaying the red line crossing over downward of the green line.
On the RSI there is a similar pattern as the price action, notice the series of higher lows along with the blue upward sloping support of the Ascending Triangle.
On the KST there's been a breakout of potentially a bullish flag pattern on a macro level, on a micro time frame there's been a bearish cross displaying the red line crossing over downward of the green line.

Publications connexes
Clause de non-responsabilité
Les informations et publications ne sont pas destinées à être, et ne constituent pas, des conseils ou recommandations financiers, d'investissement, de trading ou autres fournis ou approuvés par TradingView. Pour en savoir plus, consultez les Conditions d'utilisation.
Publications connexes
Clause de non-responsabilité
Les informations et publications ne sont pas destinées à être, et ne constituent pas, des conseils ou recommandations financiers, d'investissement, de trading ou autres fournis ou approuvés par TradingView. Pour en savoir plus, consultez les Conditions d'utilisation.