
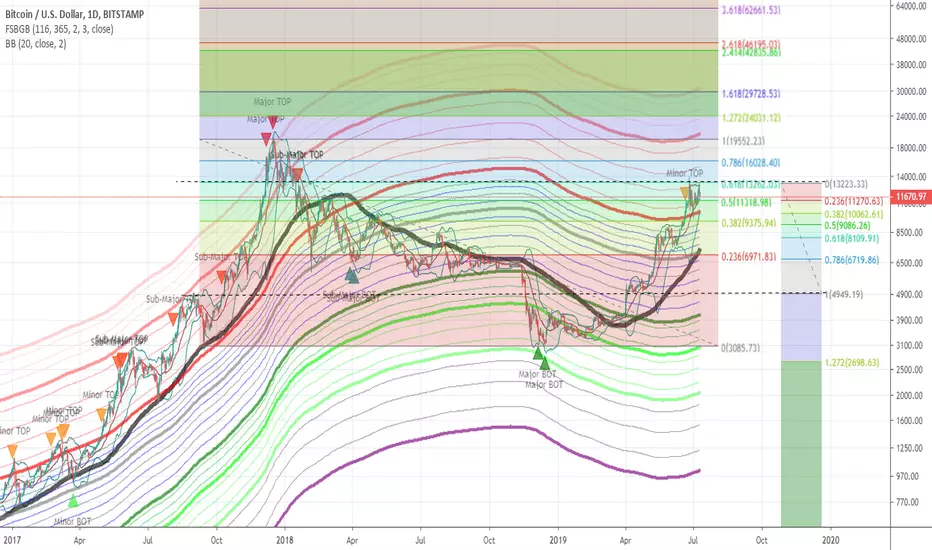
BTC presently expected to double top at 0.618 level of longer-term trend.
Expect BTC to fall back to around 8400 at 0.618 level of shorter-term trend.
Analysis rejected if double top fails, and BTC goes higher beyond and shows strong support above 14k.
See also:
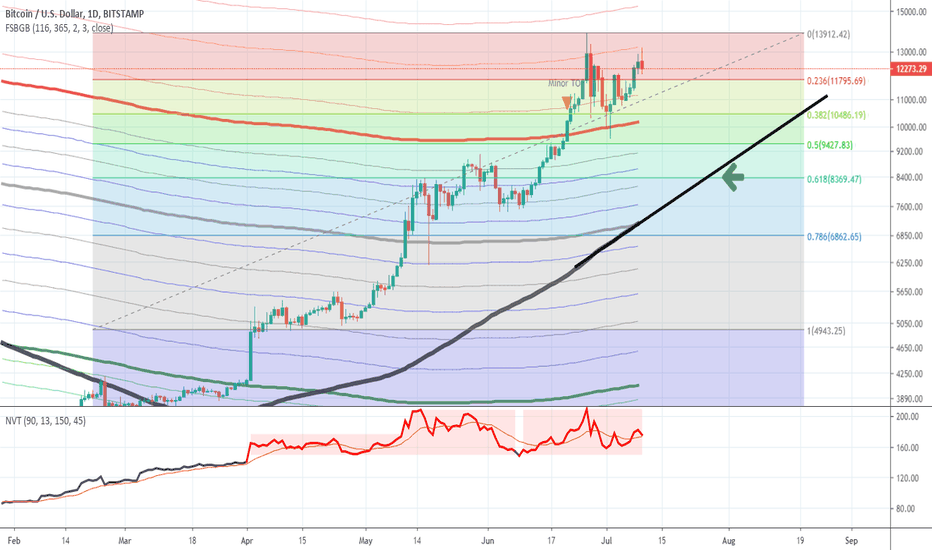
Expect BTC to fall back to around 8400 at 0.618 level of shorter-term trend.
Analysis rejected if double top fails, and BTC goes higher beyond and shows strong support above 14k.
See also:
Note
Explaination: The FSBGB indicator shows that historically, we have presently reached a local top corresponding to the FSBGB-levels where local-tops were logged during the stage of the bull-market from 2016 till April of 2017, before the "red" FSBGB-level was eventually breached.Note
Link to indicator used: tradingview.com/v/N0FyoIlB/
Clause de non-responsabilité
Les informations et publications ne sont pas destinées à être, et ne constituent pas, des conseils ou recommandations financiers, d'investissement, de trading ou autres fournis ou approuvés par TradingView. Pour en savoir plus, consultez les Conditions d'utilisation.
Clause de non-responsabilité
Les informations et publications ne sont pas destinées à être, et ne constituent pas, des conseils ou recommandations financiers, d'investissement, de trading ou autres fournis ou approuvés par TradingView. Pour en savoir plus, consultez les Conditions d'utilisation.