
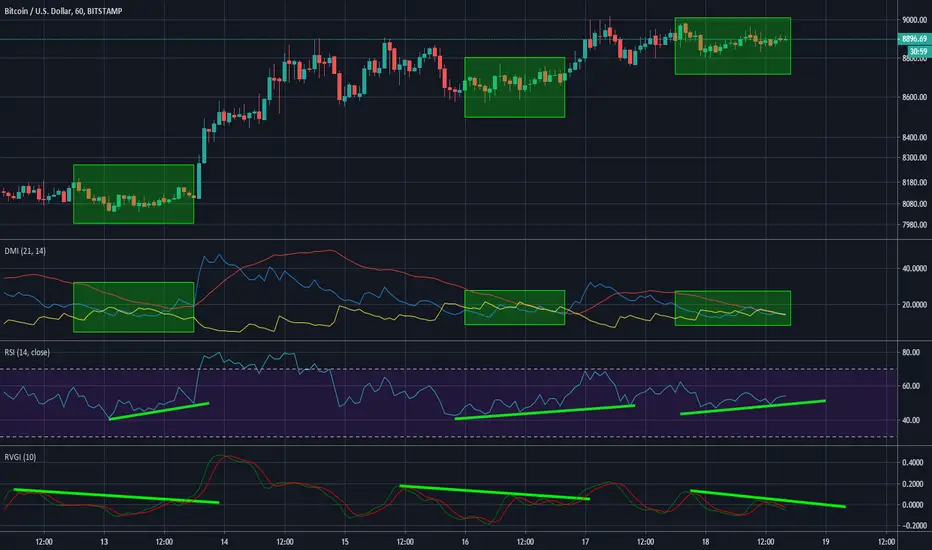
I know a lot of chart analyzers with a lot of good reasons are calling this a bearish move down to $8,500-$8,300, and I am kinda seduced by their idea, but I cannot hide this idea that it "might" go up to $9,200 first!
To me, these patters (shown in the chart above) shows a sudden Bull move in the last few days. Why not today?
Pay attention to a side move and indicators. (Green boxes and green lines)
To me, these patters (shown in the chart above) shows a sudden Bull move in the last few days. Why not today?
Pay attention to a side move and indicators. (Green boxes and green lines)
Transaction en cours
in DMI indicator, ADX line shows inclining which is a bull sign. Trend has passed and crossed triangle upper side (see my previous post for the triangular pattern).It is still NOT confirmed to be a bullish move to $9200. Trade wisely.
Transaction en cours
You're welcome! :)
Publications connexes
Clause de non-responsabilité
Les informations et publications ne sont pas destinées à être, et ne constituent pas, des conseils ou recommandations financiers, d'investissement, de trading ou autres fournis ou approuvés par TradingView. Pour en savoir plus, consultez les Conditions d'utilisation.
Publications connexes
Clause de non-responsabilité
Les informations et publications ne sont pas destinées à être, et ne constituent pas, des conseils ou recommandations financiers, d'investissement, de trading ou autres fournis ou approuvés par TradingView. Pour en savoir plus, consultez les Conditions d'utilisation.