
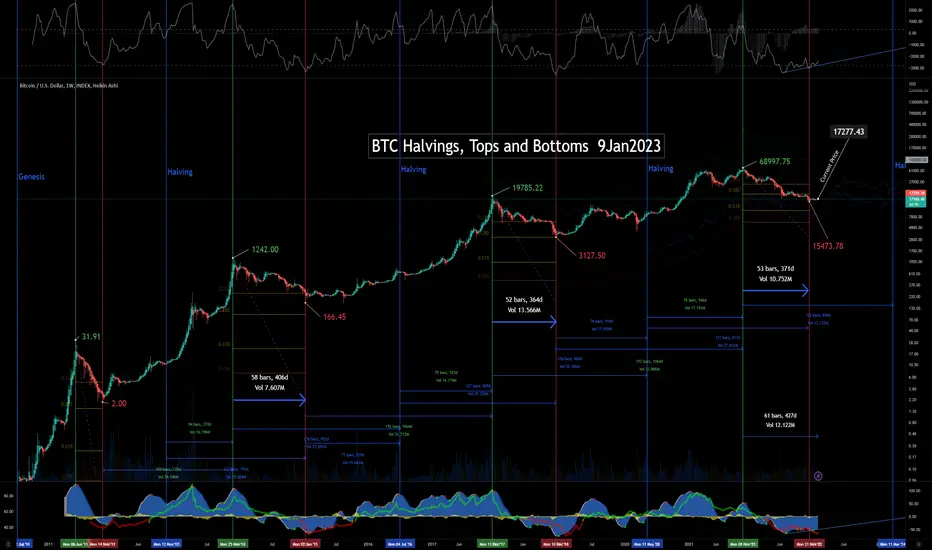
Latest update of an X-axis chart. Prices labeled for all cycle tops and bottoms. Dates marked for tops, bottoms and halvings.
Could easily see a 2x of previous ATH in 2025. Expecting slow trend upward with volatility increasing into the halving/ Fed pivot, then a parabolic 5-wave run up above 100k in 2025.
This version also includes time measurements of relevant cycle relationships.
Could easily see a 2x of previous ATH in 2025. Expecting slow trend upward with volatility increasing into the halving/ Fed pivot, then a parabolic 5-wave run up above 100k in 2025.
This version also includes time measurements of relevant cycle relationships.

Clause de non-responsabilité
Les informations et publications ne sont pas destinées à être, et ne constituent pas, des conseils ou recommandations financiers, d'investissement, de trading ou autres fournis ou approuvés par TradingView. Pour en savoir plus, consultez les Conditions d'utilisation.
Clause de non-responsabilité
Les informations et publications ne sont pas destinées à être, et ne constituent pas, des conseils ou recommandations financiers, d'investissement, de trading ou autres fournis ou approuvés par TradingView. Pour en savoir plus, consultez les Conditions d'utilisation.