
b]September Support Gives Way
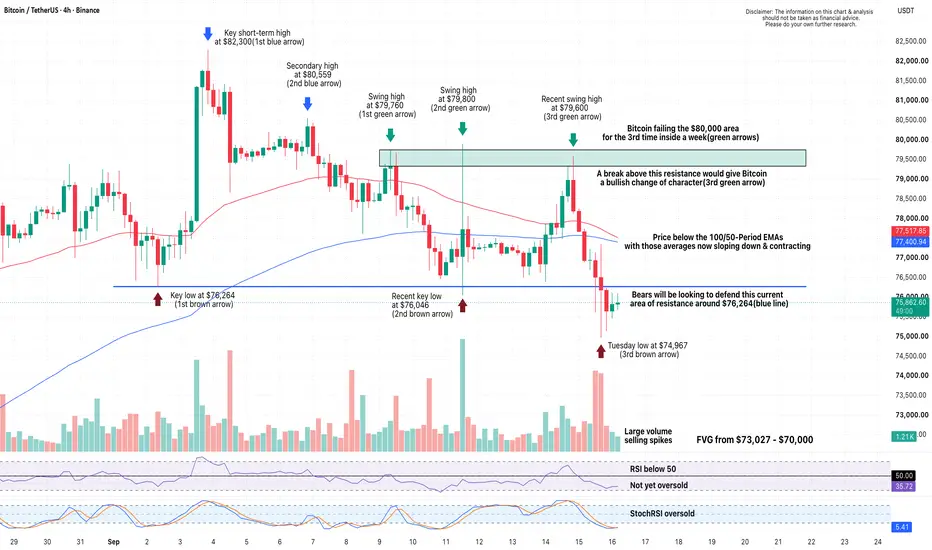
Bitcoin has broken below the key September lows around $76,264, weakening the recent medium-term recovery. That former support now becomes an important area of potential resistance.
Lower Highs Continue
The breakdown follows Bitcoin's third rejection from the $79,600–$80,000 area in little over a week. This continues the recent sequence of lower highs from the $82,300 peak.
Moving Averages Turn Bearish
Price is now below the 100/50-period EMAs, with both averages sloping lower and contracting. This adds further weight to the deterioration in the 4-hour trend.
Selling Volume Picks Up
The break through support was accompanied by two sizeable spikes in selling volume. This gives the breakdown more significance than a low-volume move beneath support would have.
Momentum Is Stretched
RSI remains below 50 but is not yet oversold, suggesting there could still be room for further weakness. StochRSI, however, is already oversold, so a short-term bounce would not be surprising.
Next Area Below
Tuesday's low at $74,967 is the immediate level to watch. If that fails, the daily FVG between roughly $73,027 and $70,000 becomes the next broader area of interest.
In Summary
Bitcoin has lost an important September support after repeatedly failing around $80,000, with increased selling volume adding weight to the breakdown. Price is also below the declining 100/50-period EMAs, while RSI remains bearish below 50. A short-term bounce is possible with StochRSI oversold, but $76,264 may now act as resistance. Unless bulls reclaim that level, attention shifts towards $74,967 and potentially the daily FVG below.
Bitcoin has broken below the key September lows around $76,264, weakening the recent medium-term recovery. That former support now becomes an important area of potential resistance.
Lower Highs Continue
The breakdown follows Bitcoin's third rejection from the $79,600–$80,000 area in little over a week. This continues the recent sequence of lower highs from the $82,300 peak.
Moving Averages Turn Bearish
Price is now below the 100/50-period EMAs, with both averages sloping lower and contracting. This adds further weight to the deterioration in the 4-hour trend.
Selling Volume Picks Up
The break through support was accompanied by two sizeable spikes in selling volume. This gives the breakdown more significance than a low-volume move beneath support would have.
Momentum Is Stretched
RSI remains below 50 but is not yet oversold, suggesting there could still be room for further weakness. StochRSI, however, is already oversold, so a short-term bounce would not be surprising.
Next Area Below
Tuesday's low at $74,967 is the immediate level to watch. If that fails, the daily FVG between roughly $73,027 and $70,000 becomes the next broader area of interest.
In Summary
Bitcoin has lost an important September support after repeatedly failing around $80,000, with increased selling volume adding weight to the breakdown. Price is also below the declining 100/50-period EMAs, while RSI remains bearish below 50. A short-term bounce is possible with StochRSI oversold, but $76,264 may now act as resistance. Unless bulls reclaim that level, attention shifts towards $74,967 and potentially the daily FVG below.

I analyse markets by observing levels, patterns, and structure. I share my process and reasoning for educational purposes, helping readers understand market behaviour without giving advice or predictions.
Clause de non-responsabilité
Les informations et publications ne sont pas destinées à être, et ne constituent pas, des conseils ou recommandations financiers, d'investissement, de trading ou autres fournis ou approuvés par TradingView. Pour en savoir plus, consultez les Conditions d'utilisation.
I analyse markets by observing levels, patterns, and structure. I share my process and reasoning for educational purposes, helping readers understand market behaviour without giving advice or predictions.
Clause de non-responsabilité
Les informations et publications ne sont pas destinées à être, et ne constituent pas, des conseils ou recommandations financiers, d'investissement, de trading ou autres fournis ou approuvés par TradingView. Pour en savoir plus, consultez les Conditions d'utilisation.