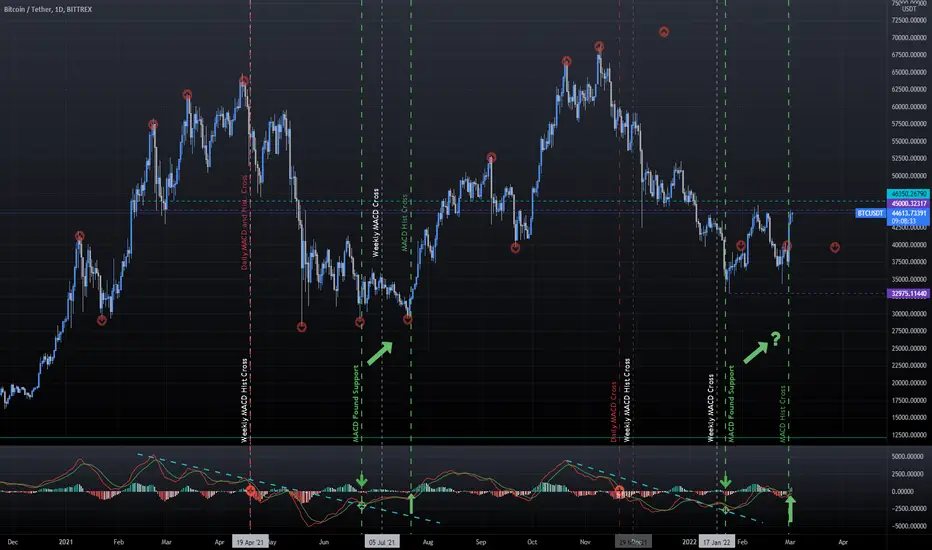
It seems history is repeating.
Weekly MACD histogram and daily MACD and histogram crossing negative preceded the crash in May. Daily MACD finding support, followed by the histogram crossing positive marked the start of the rally in August.
The same sequence of events has just completed in the last few days. Time for a bull run?
Weekly MACD histogram and daily MACD and histogram crossing negative preceded the crash in May. Daily MACD finding support, followed by the histogram crossing positive marked the start of the rally in August.
The same sequence of events has just completed in the last few days. Time for a bull run?

Clause de non-responsabilité
Les informations et publications ne sont pas destinées à être, et ne constituent pas, des conseils ou recommandations financiers, d'investissement, de trading ou autres fournis ou approuvés par TradingView. Pour en savoir plus, consultez les Conditions d'utilisation.
Clause de non-responsabilité
Les informations et publications ne sont pas destinées à être, et ne constituent pas, des conseils ou recommandations financiers, d'investissement, de trading ou autres fournis ou approuvés par TradingView. Pour en savoir plus, consultez les Conditions d'utilisation.