
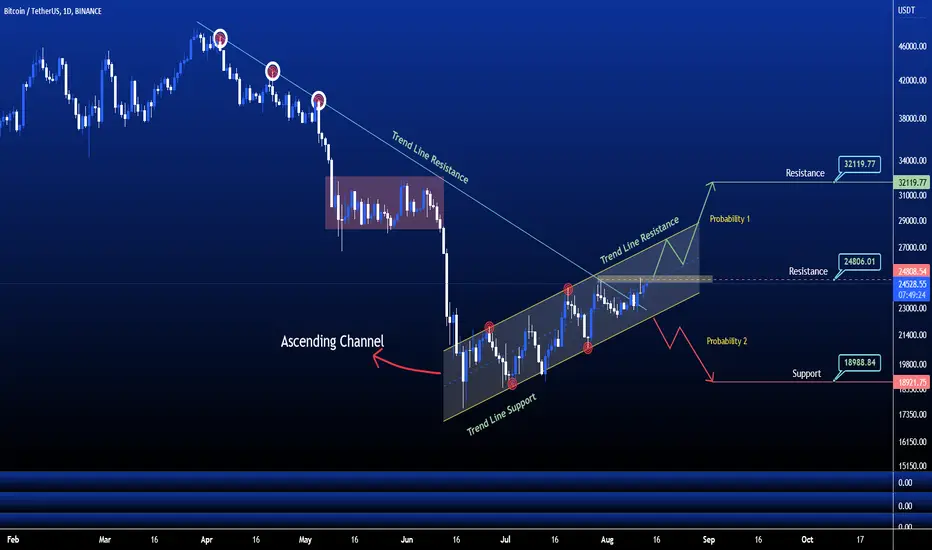
The above chart of Bitcoin laid out an ascending channel pattern. Ascending channel also known as the rising channel. The upper and lower trend lines that connect the higher highs and higher lows respectively appear to move within a rising slope. This pattern is generally a characteristic of a bullish trend.
Currently, Bitcoin (BTC) is in the range of $24515. If the pattern continues, the price of BTC might reach the resistance levels of $32119.If the trend reverses, then the price of BTC may fall to $18988
Comment your direction Probability 1 or Probability 2 ?
Currently, Bitcoin (BTC) is in the range of $24515. If the pattern continues, the price of BTC might reach the resistance levels of $32119.If the trend reverses, then the price of BTC may fall to $18988
Comment your direction Probability 1 or Probability 2 ?
Note
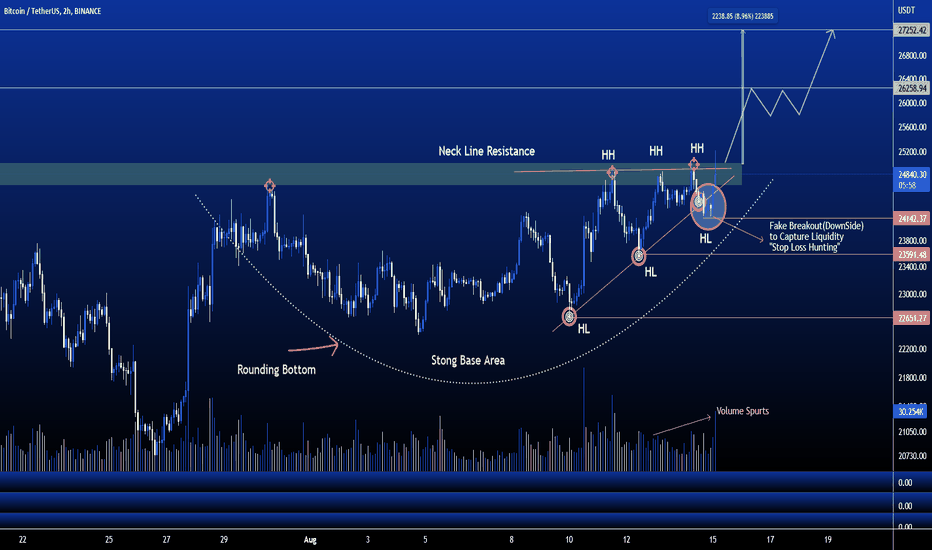
Note

Publications connexes
Clause de non-responsabilité
Les informations et publications ne sont pas destinées à être, et ne constituent pas, des conseils ou recommandations financiers, d'investissement, de trading ou autres fournis ou approuvés par TradingView. Pour en savoir plus, consultez les Conditions d'utilisation.
Publications connexes
Clause de non-responsabilité
Les informations et publications ne sont pas destinées à être, et ne constituent pas, des conseils ou recommandations financiers, d'investissement, de trading ou autres fournis ou approuvés par TradingView. Pour en savoir plus, consultez les Conditions d'utilisation.