
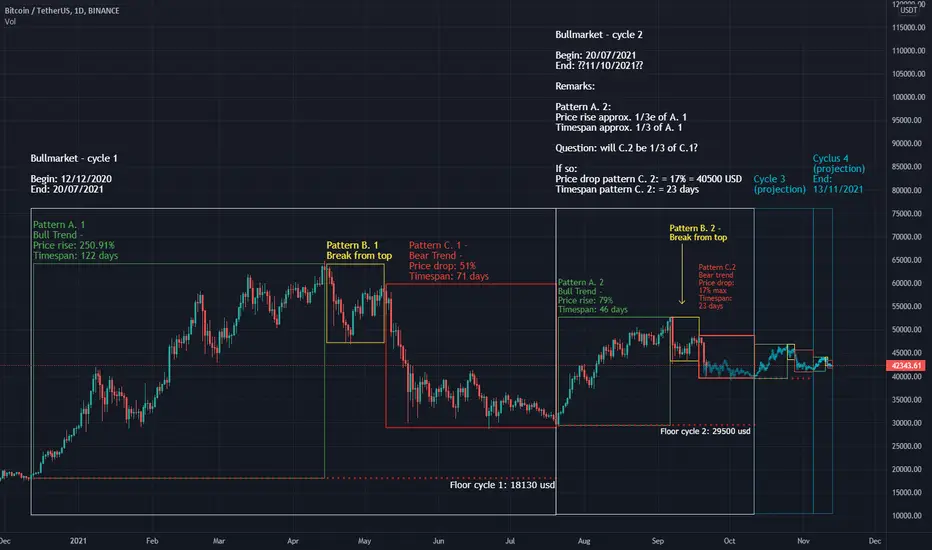
This analysis highlights the patterns that repeat on the daily BTC-USDT chart, and projects what were to happen if these patterns were to keep repeating.
It shows the emergence of a symmetrical wedge.
This leads to a second chart, illustrating the symmetrical wedge poised for breakout second half of November to a top of 90.000 USD / BTC. It is linked as a related idea.
It shows the emergence of a symmetrical wedge.
This leads to a second chart, illustrating the symmetrical wedge poised for breakout second half of November to a top of 90.000 USD / BTC. It is linked as a related idea.

Clause de non-responsabilité
Les informations et publications ne sont pas destinées à être, et ne constituent pas, des conseils ou recommandations financiers, d'investissement, de trading ou autres fournis ou approuvés par TradingView. Pour en savoir plus, consultez les Conditions d'utilisation.
Clause de non-responsabilité
Les informations et publications ne sont pas destinées à être, et ne constituent pas, des conseils ou recommandations financiers, d'investissement, de trading ou autres fournis ou approuvés par TradingView. Pour en savoir plus, consultez les Conditions d'utilisation.