
Daily chart:
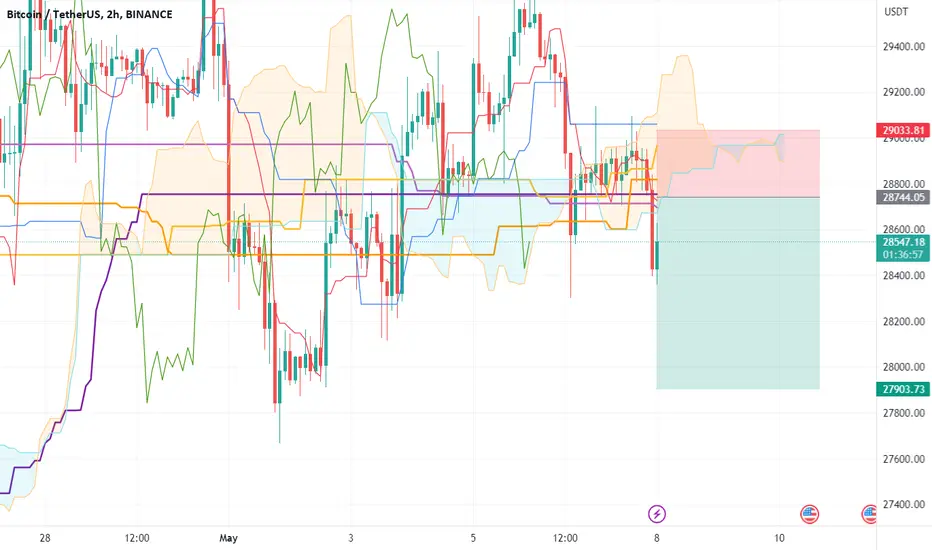
price equilibrium is the 29000 Kijun line, the price is below the Kijun line. Although the daily candle has not closed yet, the current position of the price is entering the cloud.
These two shows that selling is dominating. However, if the price crosses the Kijun line, be careful.
H4 chart:
If the price closes below 28400 and is confirmed, the sellers have the upper hand.
You can enter the sell side with the target at 27800, and stop loss at 29150.
price equilibrium is the 29000 Kijun line, the price is below the Kijun line. Although the daily candle has not closed yet, the current position of the price is entering the cloud.
These two shows that selling is dominating. However, if the price crosses the Kijun line, be careful.
H4 chart:
If the price closes below 28400 and is confirmed, the sellers have the upper hand.
You can enter the sell side with the target at 27800, and stop loss at 29150.
Trade fermée: cible de profit atteinte

Clause de non-responsabilité
Les informations et publications ne sont pas destinées à être, et ne constituent pas, des conseils ou recommandations financiers, d'investissement, de trading ou autres fournis ou approuvés par TradingView. Pour en savoir plus, consultez les Conditions d'utilisation.
Clause de non-responsabilité
Les informations et publications ne sont pas destinées à être, et ne constituent pas, des conseils ou recommandations financiers, d'investissement, de trading ou autres fournis ou approuvés par TradingView. Pour en savoir plus, consultez les Conditions d'utilisation.