Hello, everyone!
Today I noticed the insane chart pattern on the
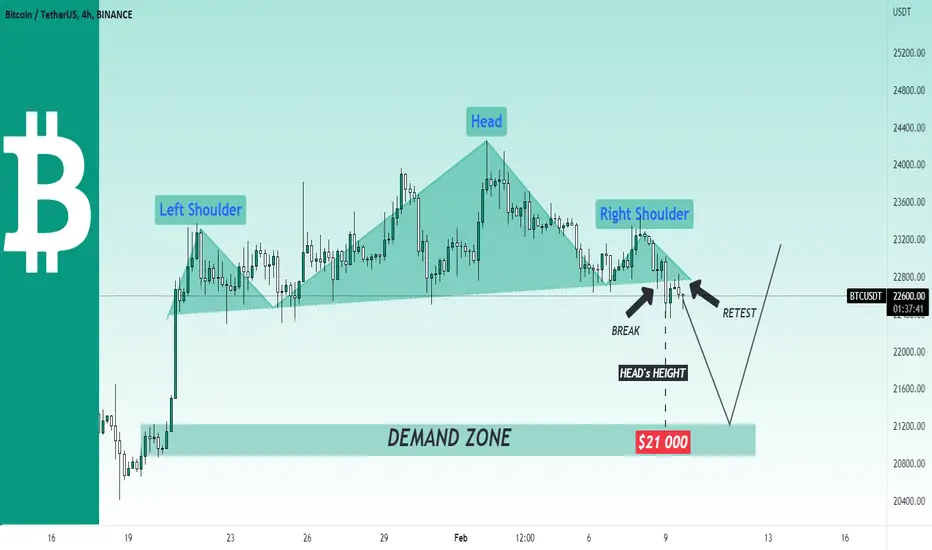
 BTCUSDT price chart. Bitcoin is showing the weakness last week and now it completed the head & shoulders chart pattern. Notice that it's neckline has been already broken and BTC has successfully retested it.
We saw the reaction on this neckline, therefore I expect the dump to the nearest demand zone at $21k. There I am going to buy Bitcoin with the further potential increase to $28k.
Best regards, Ivan
Today I noticed the insane chart pattern on the
BTCUSDT price chart. Bitcoin is showing the weakness last week and now it completed the head & shoulders chart pattern. Notice that it's neckline has been already broken and BTC has successfully retested it. We saw the reaction on this neckline, therefore I expect the dump to the nearest demand zone at $21k. There I am going to buy Bitcoin with the further potential increase to $28k.
Best regards, Ivan

Turn TradingView indicator & strategy alerts into automated trades on major crypto exchanges using no-code bots
Start free at skyrexio.com
Start free at skyrexio.com
Publications connexes
Clause de non-responsabilité
Les informations et publications ne sont pas destinées à être, et ne constituent pas, des conseils ou recommandations financiers, d'investissement, de trading ou autres fournis ou approuvés par TradingView. Pour en savoir plus, consultez les Conditions d'utilisation.
Turn TradingView indicator & strategy alerts into automated trades on major crypto exchanges using no-code bots
Start free at skyrexio.com
Start free at skyrexio.com
Publications connexes
Clause de non-responsabilité
Les informations et publications ne sont pas destinées à être, et ne constituent pas, des conseils ou recommandations financiers, d'investissement, de trading ou autres fournis ou approuvés par TradingView. Pour en savoir plus, consultez les Conditions d'utilisation.