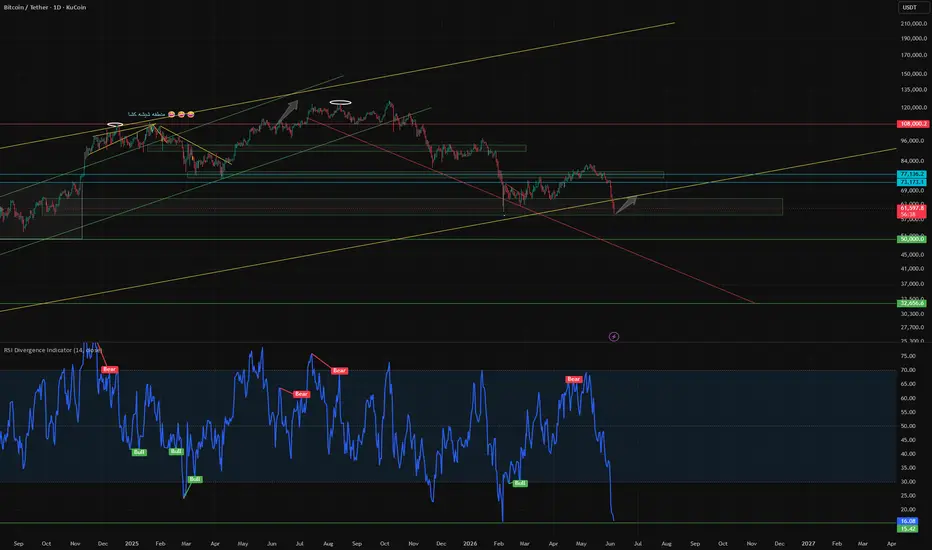
 BTC BTC Daily Analysis – Current Price: $60,000
On the daily timeframe, Bitcoin remains in a corrective structure after recent downside pressure, but it has now reached a key support zone around $60,000 where most oscillators have entered oversold territory.
RSI is in Extreme Oversold, MFI is Oversold, CCI shows Strong Oversold, and Stochastic is also Oversold – a rare alignment across all major momentum indicators. Historically, such extreme conditions near a major support level often precede at least a short-term rebound.
ATR shows high volatility, volume is very high, and ADX remains strong, indicating the downtrend is still intact but showing signs of seller exhaustion. The low Up/Down ratio (0.29) confirms recent bearish dominance.
Possible scenarios:
🟢 65% probability:
A temporary bottom forms at current levels, leading to a relief rally toward $64,000 – $68,000.
🟡 20% probability:
Several weeks of consolidation between $58,000 and $62,000 to absorb selling pressure.
🔴 15% probability:
Break of $60,000 support and continuation toward $56,000 – $54,000.
Downside risk appears limited at these levels, while the potential for a mean-reversion bounce is increasing. The combination of oversold oscillators and high volume suggests accumulation interest beneath the surface.
My personal view:
This area resembles an accumulation zone rather than a distribution phase. A bounce toward $64,000 – $65,000 is likely before any further directional decision.
DrKhashix loves you all
#BTC #Bitcoin #Crypto#
image

Clause de non-responsabilité
Les informations et publications ne sont pas destinées à être, et ne constituent pas, des conseils ou recommandations financiers, d'investissement, de trading ou autres fournis ou approuvés par TradingView. Pour en savoir plus, consultez les Conditions d'utilisation.
Clause de non-responsabilité
Les informations et publications ne sont pas destinées à être, et ne constituent pas, des conseils ou recommandations financiers, d'investissement, de trading ou autres fournis ou approuvés par TradingView. Pour en savoir plus, consultez les Conditions d'utilisation.