
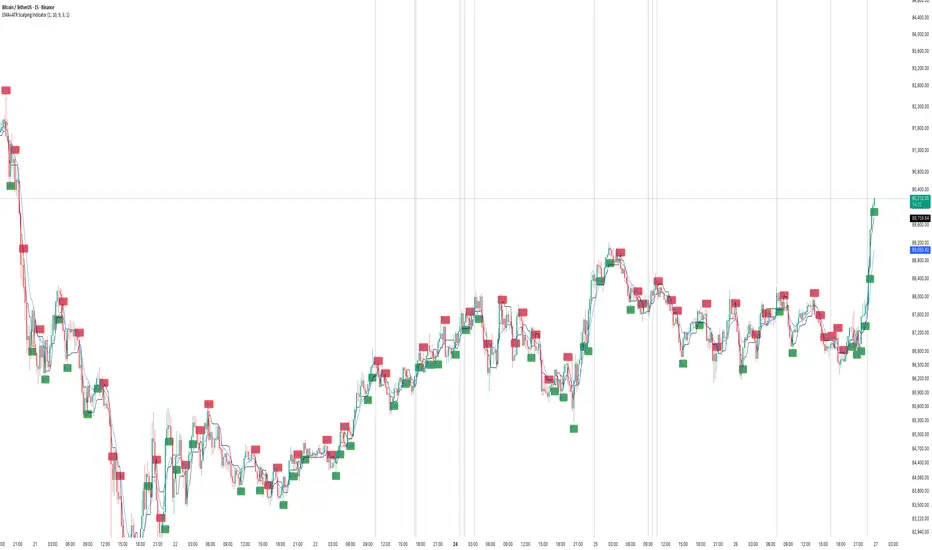
📌 EMA + ATR Scalping Indicator – Performance Breakdown (Based on Chart)
This was my first indicator ever (built last year), and seeing its performance on the chart today again reminds me why it worked so well for both scalping and swing-style trend capture.
🔹 What the Indicator Is Doing on This Chart
1. Capturing Trend Direction Early
The combination of the EMA (trend filter) and ATR-based trailing stop (volatility filter) helps the indicator catch directional moves very cleanly.
• During strong directional phases (uptrends or downtrends), the signals appear right as momentum shifts.
• In the first half of the chart, every bearish impulse is detected quickly, and the EMA+ATR cross confirms continuation.
You can clearly see how:
✔ The SELL signals appear early on sustained drops
✔ The BUY signals appear early when bullish momentum kicks in
✔ There are hardly any “late” entries due to ATR’s responsiveness
⸻
2. Reversal Detection Is Smooth & Immediate
One of the strongest parts of this indicator is how it flips direction without delay.
Whenever price breaks the ATR trailing stop from the opposite side:
➡ A reversal signal is generated
➡ The previous directional bias is cancelled
This prevents holding a wrong-bias trade for too long.
Even in sideways phases, reversals are caught fast—helping scalpers avoid getting stuck.
⸻
3. Handles False Breakouts Surprisingly Well
This chart shows multiple places where price tries to break in one direction but gets rejected immediately.
The indicator reacts quickly because:
• EMA confirms the micro-trend
• ATR trailing stop invalidates fake moves
• The system flips signal as soon as true momentum appears
This “two-layer confirmation” makes the signals tighter and reduces whipsaws.
So yes—capturing false breakouts and flipping instantly is one of the biggest USPs of this script.
⸻
4. Consecutive Candle Momentum Logic
The script includes a 5-bar consecutive breakout filter, which increases the probability that a breakout is real.
This further improves:
✔ Trend continuation entries
✔ Avoidance of weak or random breakouts
✔ Early detection of strong impulses
You can see how this filter helps catch those clean legs in the chart’s mid-section.
⸻
🔹 The Grey “No-Trading Zone” — A Very Useful Filter
The grey highlighted vertical bands represent periods when the ATR stays too flat.
Flat ATR = low volatility = trap zone.
The indicator marks these with:
• Grey background shading
• “No Trading Zone” label on the candle
These filtered areas clearly show:
❌ Avoid entering — market is undecisive
❌ Signals here are often fake
✔ Wait until volatility expands again
This simple visual filter improves discipline and prevents unnecessary losses.
⸻
🔹 Overall Performance on the Chart
✔ Strong Trends → Clean Signals
The indicator rides the trend well (both up and down), capturing the majority of each move.
✔ Reversals → Early Detection
Quick flips keep you aligned with the new direction without holding drawdowns.
✔ Sideways Market → Controlled Exposure
ATR-flat grey zones protect you from chop.
✔ False Breakouts → Immediate Recovery
When the initial direction fails, the indicator immediately prints the opposite signal.
✔ Scalping & Swing Both Supported
The fast ATR logic supports scalpers,
the EMA confirmation supports swing traders.
⸻
🔹 Why This Indicator Still Feels Powerful (Even Today)
Because it is built on three timeless trading foundations:
1. Trend logic (EMA)
2. Volatility logic (ATR)
3. Breakout momentum (5-bar filter)
These three combine in a very natural way—hence the clean signals you see on the chart.
This was my first indicator ever (built last year), and seeing its performance on the chart today again reminds me why it worked so well for both scalping and swing-style trend capture.
🔹 What the Indicator Is Doing on This Chart
1. Capturing Trend Direction Early
The combination of the EMA (trend filter) and ATR-based trailing stop (volatility filter) helps the indicator catch directional moves very cleanly.
• During strong directional phases (uptrends or downtrends), the signals appear right as momentum shifts.
• In the first half of the chart, every bearish impulse is detected quickly, and the EMA+ATR cross confirms continuation.
You can clearly see how:
✔ The SELL signals appear early on sustained drops
✔ The BUY signals appear early when bullish momentum kicks in
✔ There are hardly any “late” entries due to ATR’s responsiveness
⸻
2. Reversal Detection Is Smooth & Immediate
One of the strongest parts of this indicator is how it flips direction without delay.
Whenever price breaks the ATR trailing stop from the opposite side:
➡ A reversal signal is generated
➡ The previous directional bias is cancelled
This prevents holding a wrong-bias trade for too long.
Even in sideways phases, reversals are caught fast—helping scalpers avoid getting stuck.
⸻
3. Handles False Breakouts Surprisingly Well
This chart shows multiple places where price tries to break in one direction but gets rejected immediately.
The indicator reacts quickly because:
• EMA confirms the micro-trend
• ATR trailing stop invalidates fake moves
• The system flips signal as soon as true momentum appears
This “two-layer confirmation” makes the signals tighter and reduces whipsaws.
So yes—capturing false breakouts and flipping instantly is one of the biggest USPs of this script.
⸻
4. Consecutive Candle Momentum Logic
The script includes a 5-bar consecutive breakout filter, which increases the probability that a breakout is real.
This further improves:
✔ Trend continuation entries
✔ Avoidance of weak or random breakouts
✔ Early detection of strong impulses
You can see how this filter helps catch those clean legs in the chart’s mid-section.
⸻
🔹 The Grey “No-Trading Zone” — A Very Useful Filter
The grey highlighted vertical bands represent periods when the ATR stays too flat.
Flat ATR = low volatility = trap zone.
The indicator marks these with:
• Grey background shading
• “No Trading Zone” label on the candle
These filtered areas clearly show:
❌ Avoid entering — market is undecisive
❌ Signals here are often fake
✔ Wait until volatility expands again
This simple visual filter improves discipline and prevents unnecessary losses.
⸻
🔹 Overall Performance on the Chart
✔ Strong Trends → Clean Signals
The indicator rides the trend well (both up and down), capturing the majority of each move.
✔ Reversals → Early Detection
Quick flips keep you aligned with the new direction without holding drawdowns.
✔ Sideways Market → Controlled Exposure
ATR-flat grey zones protect you from chop.
✔ False Breakouts → Immediate Recovery
When the initial direction fails, the indicator immediately prints the opposite signal.
✔ Scalping & Swing Both Supported
The fast ATR logic supports scalpers,
the EMA confirmation supports swing traders.
⸻
🔹 Why This Indicator Still Feels Powerful (Even Today)
Because it is built on three timeless trading foundations:
1. Trend logic (EMA)
2. Volatility logic (ATR)
3. Breakout momentum (5-bar filter)
These three combine in a very natural way—hence the clean signals you see on the chart.

Thanks.
TradeTech Analysis
Telegram Channel - t.me/Tradetech2024
Youtube Channel - youtube.com/@TradeTechAnalysis
Website - tradetechanalysis.com/
Super Profile - superprofile.bio/tradetechanalysis
TradeTech Analysis
Telegram Channel - t.me/Tradetech2024
Youtube Channel - youtube.com/@TradeTechAnalysis
Website - tradetechanalysis.com/
Super Profile - superprofile.bio/tradetechanalysis
Clause de non-responsabilité
Les informations et publications ne sont pas destinées à être, et ne constituent pas, des conseils ou recommandations financiers, d'investissement, de trading ou autres fournis ou approuvés par TradingView. Pour en savoir plus, consultez les Conditions d'utilisation.
Thanks.
TradeTech Analysis
Telegram Channel - t.me/Tradetech2024
Youtube Channel - youtube.com/@TradeTechAnalysis
Website - tradetechanalysis.com/
Super Profile - superprofile.bio/tradetechanalysis
TradeTech Analysis
Telegram Channel - t.me/Tradetech2024
Youtube Channel - youtube.com/@TradeTechAnalysis
Website - tradetechanalysis.com/
Super Profile - superprofile.bio/tradetechanalysis
Clause de non-responsabilité
Les informations et publications ne sont pas destinées à être, et ne constituent pas, des conseils ou recommandations financiers, d'investissement, de trading ou autres fournis ou approuvés par TradingView. Pour en savoir plus, consultez les Conditions d'utilisation.