
Hello, fellow traders!
Follow us to get the latest updates quickly.
Have a great day!
-------------------------------------
#BTCUSDT
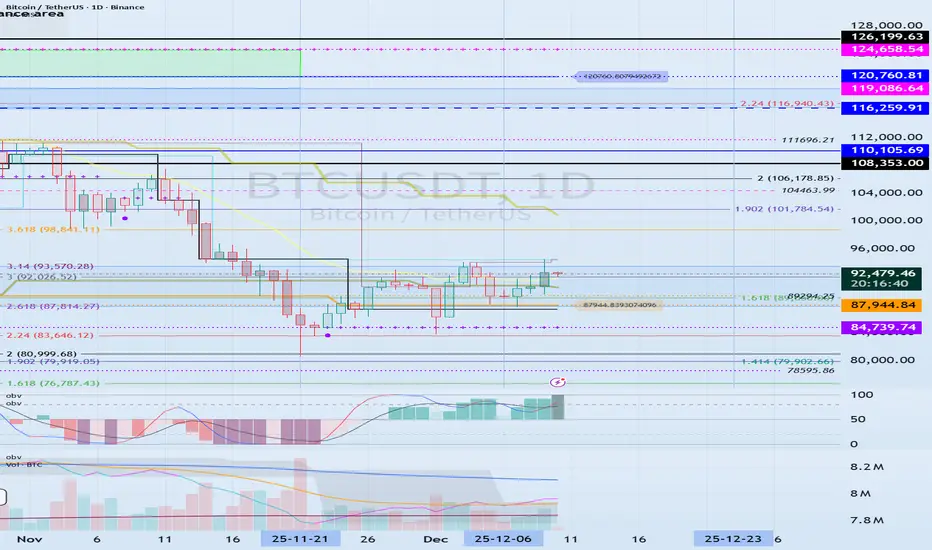
To initiate a bullish trend, the price must rise above and sustain the OBV Low indicator level.
Considering the basic trading strategy of buying around DOM(-60) ~ HA-Low and selling around HA-High ~ DOM(60), the current price position represents a buying opportunity.
However, if the price falls between DOM(-60) and HA-Low, a stepwise downward trend is likely, so you should consider a response plan.
If the price falls below the DOM(-60) indicator, you should check for support around the 69000-73499.86 level.
This is because the 69000-73499.86 level represents an important support and resistance zone for sustaining an uptrend from a long-term perspective.
If the price declines from the 69,000-73,499.86 range, it is expected to form an uptrend around 42,000, a level never seen again.
-
If the price rises above the OBV Low indicator level and continues its upward trend, we should check for an upward breakout near the area circled on the chart.
If the price fails to break out, we should consider a response plan, as this could signal a full-blown bear market.
If the price continues to rise, the target levels are: - Right Fibonacci ratio 2.618 (133,889.92)
- Right Fibonacci ratio 3 (151,018.77) ~ 3.14 (157,296.36)
It is expected to re-establish the trend by rising near the above range.
The coin market is likely to experience a major bear market around the week of January 26, 2026.
-
Thank you for reading.
I wish you successful trading.
--------------------------------------------------
- Here's an explanation of the big picture.
(3-year bull market, 1-year bear market pattern)
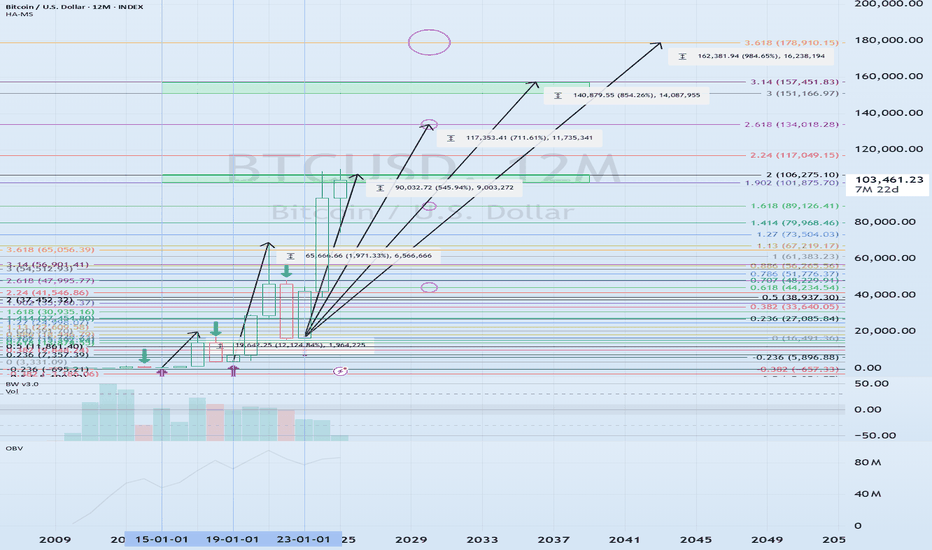
I will explain more in detail when the bear market begins.
------------------------------------------------------
Transaction en cours
#BTCUSDTThe key is whether the price can find support and rise in the 84739.74-87944.84 range.
An uptrend reversal is expected when the price rises above the left Fibonacci level of 3.14 (93570.28).
If the price falls below 84739.74, it is likely to fall to the 69000-73499.86 range.
This is because the OBV indicator is expected to fall below the Low Line and EMA 3, indicating a strong sell-off.
However, given the formation of the HA-Low indicator, we should focus on finding the right time to buy in installments.

YouTube: youtube.com/@readcrypto9837
※ Follow X to check out the posts.
※ X를 팔로우하고 게시물을 확인하세요.
◆ t.me/readCryptoChannel
[HA-MS Indicator]
bit.ly/3YxHgvN
[OBV Indicator]
bit.ly/4dcyny3
※ Follow X to check out the posts.
※ X를 팔로우하고 게시물을 확인하세요.
◆ t.me/readCryptoChannel
[HA-MS Indicator]
bit.ly/3YxHgvN
[OBV Indicator]
bit.ly/4dcyny3
Publications connexes
Clause de non-responsabilité
Les informations et publications ne sont pas destinées à être, et ne constituent pas, des conseils ou recommandations financiers, d'investissement, de trading ou autres fournis ou approuvés par TradingView. Pour en savoir plus, consultez les Conditions d'utilisation.
YouTube: youtube.com/@readcrypto9837
※ Follow X to check out the posts.
※ X를 팔로우하고 게시물을 확인하세요.
◆ t.me/readCryptoChannel
[HA-MS Indicator]
bit.ly/3YxHgvN
[OBV Indicator]
bit.ly/4dcyny3
※ Follow X to check out the posts.
※ X를 팔로우하고 게시물을 확인하세요.
◆ t.me/readCryptoChannel
[HA-MS Indicator]
bit.ly/3YxHgvN
[OBV Indicator]
bit.ly/4dcyny3
Publications connexes
Clause de non-responsabilité
Les informations et publications ne sont pas destinées à être, et ne constituent pas, des conseils ou recommandations financiers, d'investissement, de trading ou autres fournis ou approuvés par TradingView. Pour en savoir plus, consultez les Conditions d'utilisation.