
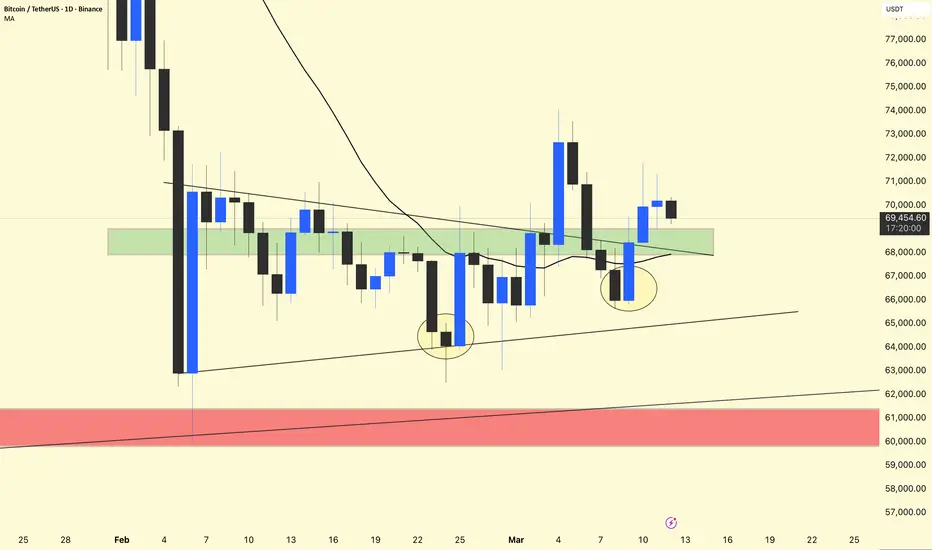
BTC/USDT – Daily Chart Quick Update
Bitcoin is trading around $69.5K, holding above the $68K support zone.
Price is bouncing from the ascending trendline support.
The $68K–$69K zone continues to act as a key demand area.
Recent candles show buyers stepping in after support tests.
Bullish Scenario:
If BTC holds above $68K, the next targets could be:
$71K
$73K resistance
Bearish Scenario:
If $68K breaks, price may drop toward:
$65K support
$60K major demand zone
⚠️ Conclusion:
BTC is still ranging near key support, and the next strong move will likely come after a break above $71K or below $68K.

Publications connexes
Clause de non-responsabilité
Les informations et publications ne sont pas destinées à être, et ne constituent pas, des conseils ou recommandations financiers, d'investissement, de trading ou autres fournis ou approuvés par TradingView. Pour en savoir plus, consultez les Conditions d'utilisation.