
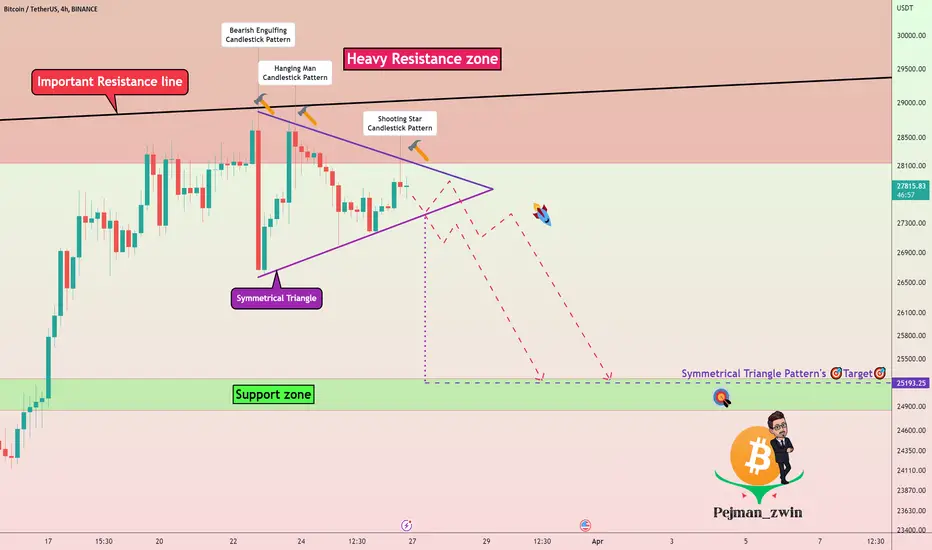
Bitcoin seems to have managed to form a symmetrical triangle near the🔴heavy resistance zone ($32,400-$28,120)🔴 and resistance line.
Also, candlestick reversal patterns on the upper line of the triangle can be a sign to break the lower line of the triangle.
I expect the lower line of the symmetrical triangle will eventually break and take Bitcoin to the 🟢support zone($25,250-$24,830)🟢.
Bitcoin Analyze ( BTCUSDT ), 4-hour time frame ⏰.
Do not forget to put Stop loss for your positions (For every position you want to open).
Please follow your strategy, this is just my Idea, and I will be glad to see your ideas in this post.
Please do not forget the ✅' like'✅ button 🙏😊 & Share it with your friends; thanks, and Trade safe.
Note
Lower line of triangle was brokenNote
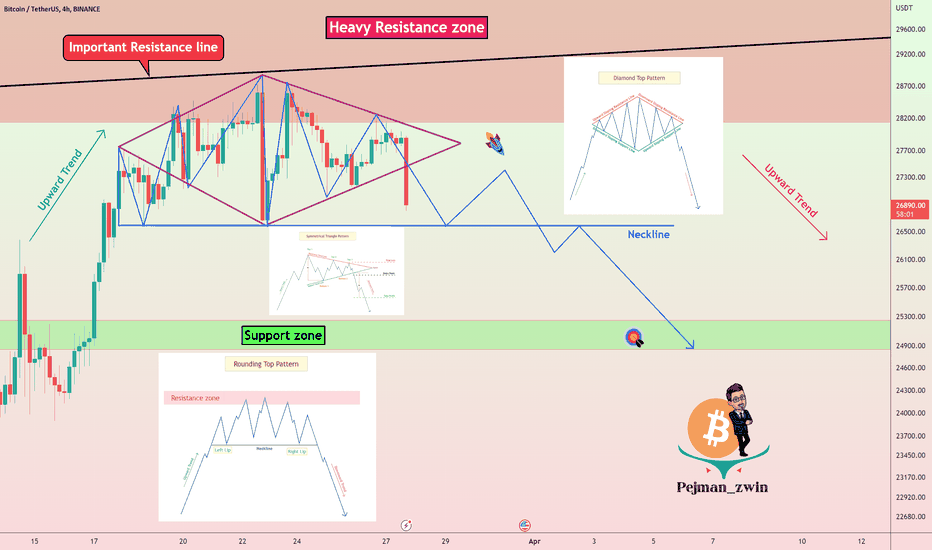
New update 👍
Note
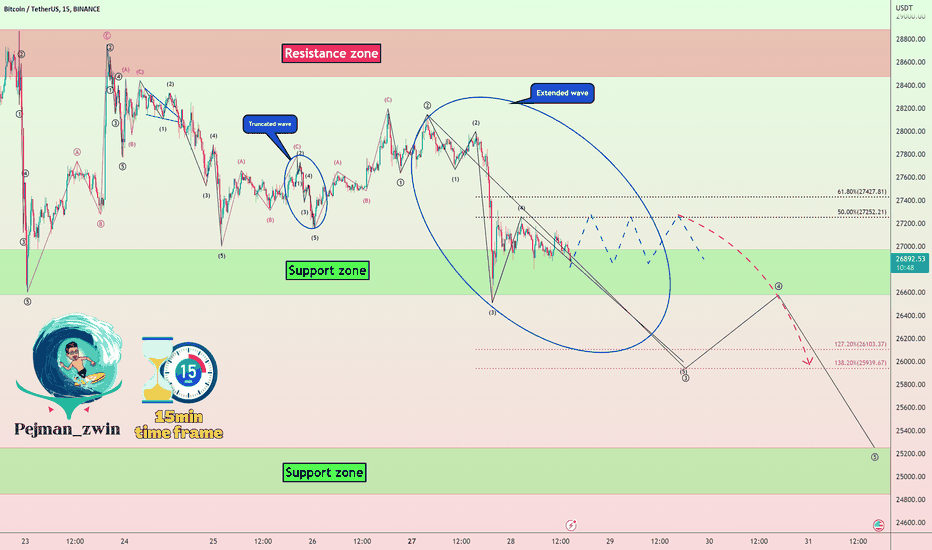
Bitcoin analysis from the point of view of Elliott waves

🎁 Free Real VIP Forex and Crypto Signals. Please visit:
🔗 t.me/ProTrader_365
🔗 t.me/ProTrader_365
Publications connexes
Clause de non-responsabilité
Les informations et publications ne sont pas destinées à être, et ne constituent pas, des conseils ou recommandations financiers, d'investissement, de trading ou autres fournis ou approuvés par TradingView. Pour en savoir plus, consultez les Conditions d'utilisation.