
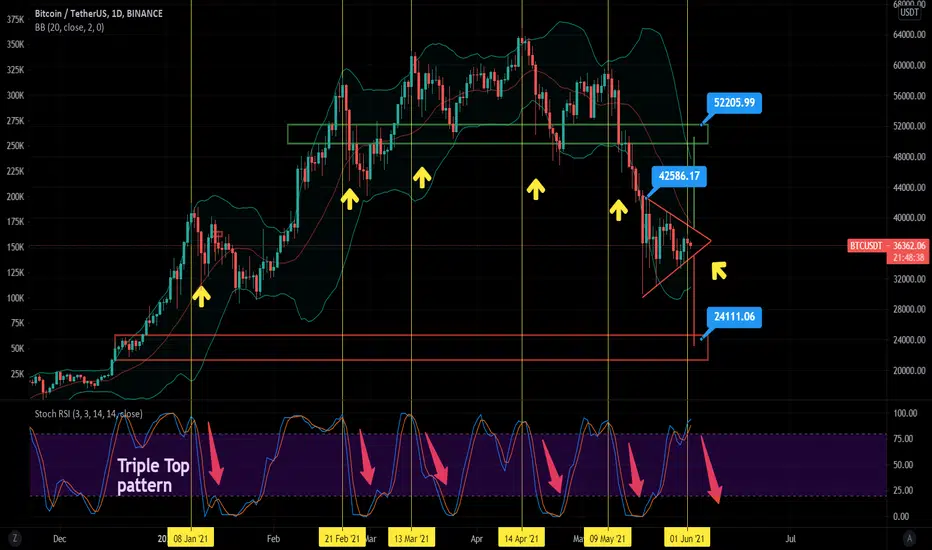
Based on BTC daily chart, it is currently still consolidating in the apex triangle . A breakout to the downside will bring us to a price target of around $24k. Otherwise, breaking to the upside will bring BTC to a price target of around $52k which is unlikely.
Bollinger Band showing a squeeze which indicates a sharp move will come soon.
Stochastic RSI is following my previous prediction where it had a final upward move before heading down. This indicates BTC will have a further correction unless BTC forms a sharp upward move and breaks $42k which will gives a Triple Top Structure in Stochastic RSI pattern(highly unlikely).
Bollinger Band showing a squeeze which indicates a sharp move will come soon.
Stochastic RSI is following my previous prediction where it had a final upward move before heading down. This indicates BTC will have a further correction unless BTC forms a sharp upward move and breaks $42k which will gives a Triple Top Structure in Stochastic RSI pattern(highly unlikely).

Publications connexes
Clause de non-responsabilité
Les informations et publications ne sont pas destinées à être, et ne constituent pas, des conseils ou recommandations financiers, d'investissement, de trading ou autres fournis ou approuvés par TradingView. Pour en savoir plus, consultez les Conditions d'utilisation.
Publications connexes
Clause de non-responsabilité
Les informations et publications ne sont pas destinées à être, et ne constituent pas, des conseils ou recommandations financiers, d'investissement, de trading ou autres fournis ou approuvés par TradingView. Pour en savoir plus, consultez les Conditions d'utilisation.