
Hello TradingView Family / Fellow Traders,
For those who know me, it's clear I always like studying previous price action.
"Know yourself, know your enemy. Many battles, many victories."
~ Sun Tzu
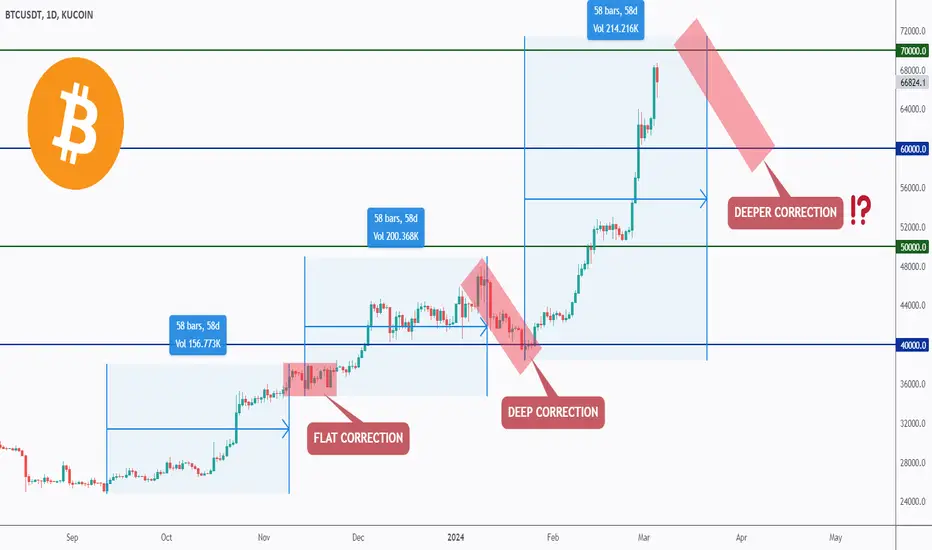
I find the Bitcoin Daily Chart interesting as it is approaching its all-time high.
If we compare this impulse movement to the previous two, we can see that after 58 days, the correction starts.
And if we look closely at the correction phase, we can see that first it was flat, and then it got deeper. Just like waves, the bigger the impulse, the bigger the correction.
Thus, when this third correction phase starts, we can expect an even deeper correction.
The question is: when will the correction start, and how deep will it be?
What do you think?
📚 Always follow your trading plan regarding entry, risk management, and trade management.
Good luck!
All Strategies Are Good; If Managed Properly!
~Richard Nasr

📊I help you turn charts into a career
theSignalyst.com
Telegram
t.me/thesignalyst
Trusted Crypto Exchange
cutt.ly/qtwKuPaJ
Trusted CFD Broker
cutt.ly/TickmillReal
Trusted Crypto Prop Firm
cutt.ly/Hyrotrader
theSignalyst.com
Telegram
t.me/thesignalyst
Trusted Crypto Exchange
cutt.ly/qtwKuPaJ
Trusted CFD Broker
cutt.ly/TickmillReal
Trusted Crypto Prop Firm
cutt.ly/Hyrotrader
Clause de non-responsabilité
Les informations et publications ne sont pas destinées à être, et ne constituent pas, des conseils ou recommandations financiers, d'investissement, de trading ou autres fournis ou approuvés par TradingView. Pour en savoir plus, consultez les Conditions d'utilisation.