
Hi Guys,
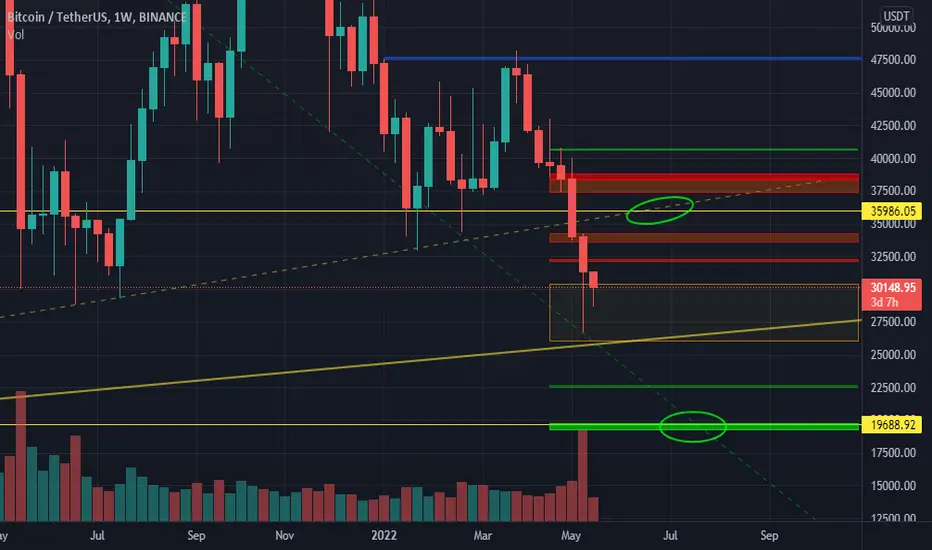
This is a schematic view on mid/long term support/resistance zones in Bitcoin.
those two green circles are highly attractive zones, price might move in a pattern to touch them. so it might give you some hints about the timing analysis.
the yellow line on current zone is very important and make sure you won't ignore it.
for a better understanding, check the post below, related to ETH.

Publications connexes
Clause de non-responsabilité
Les informations et publications ne sont pas destinées à être, et ne constituent pas, des conseils ou recommandations financiers, d'investissement, de trading ou autres fournis ou approuvés par TradingView. Pour en savoir plus, consultez les Conditions d'utilisation.