
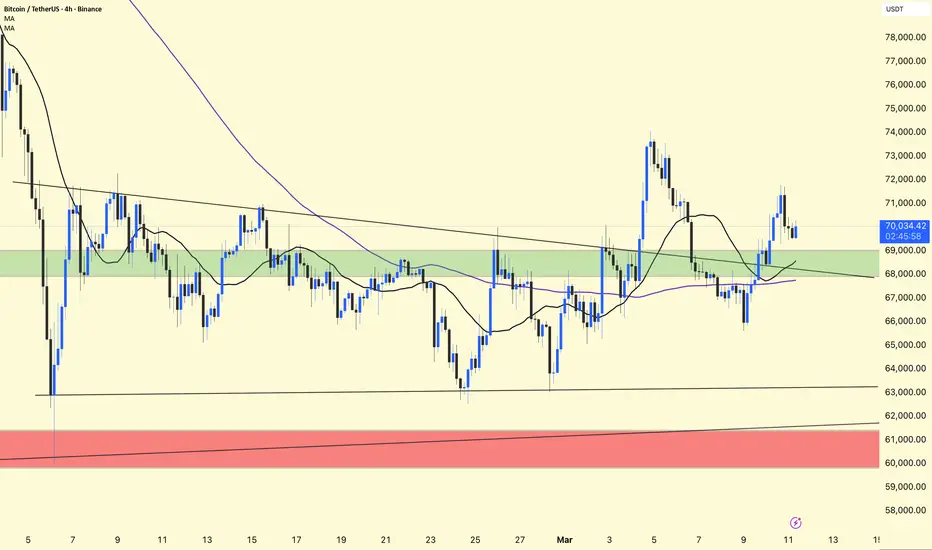
BTC/USDT – 4H Chart Update
Bitcoin is currently trading near $70K, holding above a key **support zone around $68K–$69K
* Price reclaimed the **green demand zone** and is now consolidating above it.
* The **short-term moving averages** are starting to curl upward, showing improving momentum.
* However, the **descending trendline resistance** from previous highs is still above the price.
📈 Bullish Scenario:
If BTC holds above $68K, buyers may push the price toward:
$71K – $72K resistance
Potential breakout target near $74K
📉 Bearish Scenario:
Losing $68K support could send BTC back to:
$63K support
Major demand zone around $60K–$61K
BTC is in a short-term recovery phase, but it still needs to break the descending resistance to confirm stronger upside momentum.
Bitcoin is currently trading near $70K, holding above a key **support zone around $68K–$69K
* Price reclaimed the **green demand zone** and is now consolidating above it.
* The **short-term moving averages** are starting to curl upward, showing improving momentum.
* However, the **descending trendline resistance** from previous highs is still above the price.
📈 Bullish Scenario:
If BTC holds above $68K, buyers may push the price toward:
$71K – $72K resistance
Potential breakout target near $74K
📉 Bearish Scenario:
Losing $68K support could send BTC back to:
$63K support
Major demand zone around $60K–$61K
BTC is in a short-term recovery phase, but it still needs to break the descending resistance to confirm stronger upside momentum.

Publications connexes
Clause de non-responsabilité
Les informations et publications ne sont pas destinées à être, et ne constituent pas, des conseils ou recommandations financiers, d'investissement, de trading ou autres fournis ou approuvés par TradingView. Pour en savoir plus, consultez les Conditions d'utilisation.
Publications connexes
Clause de non-responsabilité
Les informations et publications ne sont pas destinées à être, et ne constituent pas, des conseils ou recommandations financiers, d'investissement, de trading ou autres fournis ou approuvés par TradingView. Pour en savoir plus, consultez les Conditions d'utilisation.