 BTC (Current Update)
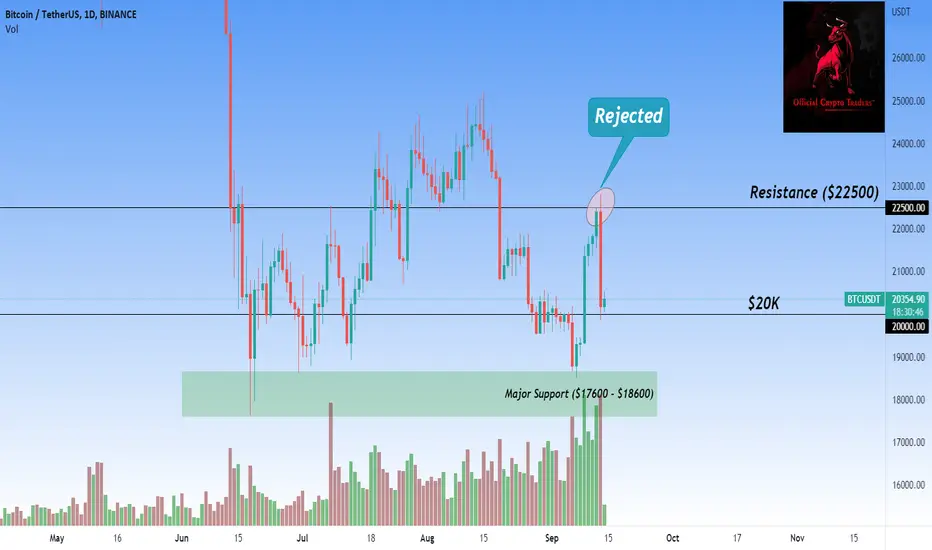
BTC Rejected It's Resistance ($22500)
And As Mentioned In The Video, A Big DownFall From Here Can Be Seen Till $20K In A Single Candle Of 1D Chart 📊
Holding Above $20K Can Lead A Test $22500 Again 📈
Breaking Below $20K, Can Test It's Major Support i.e., $17600 - $18600 📉
Which Isn't Looking A Good Sign 🛑
It May Lead To A New Low 💥📉

Clause de non-responsabilité
Les informations et publications ne sont pas destinées à être, et ne constituent pas, des conseils ou recommandations financiers, d'investissement, de trading ou autres fournis ou approuvés par TradingView. Pour en savoir plus, consultez les Conditions d'utilisation.
Clause de non-responsabilité
Les informations et publications ne sont pas destinées à être, et ne constituent pas, des conseils ou recommandations financiers, d'investissement, de trading ou autres fournis ou approuvés par TradingView. Pour en savoir plus, consultez les Conditions d'utilisation.