
WHAT HAPPENED?
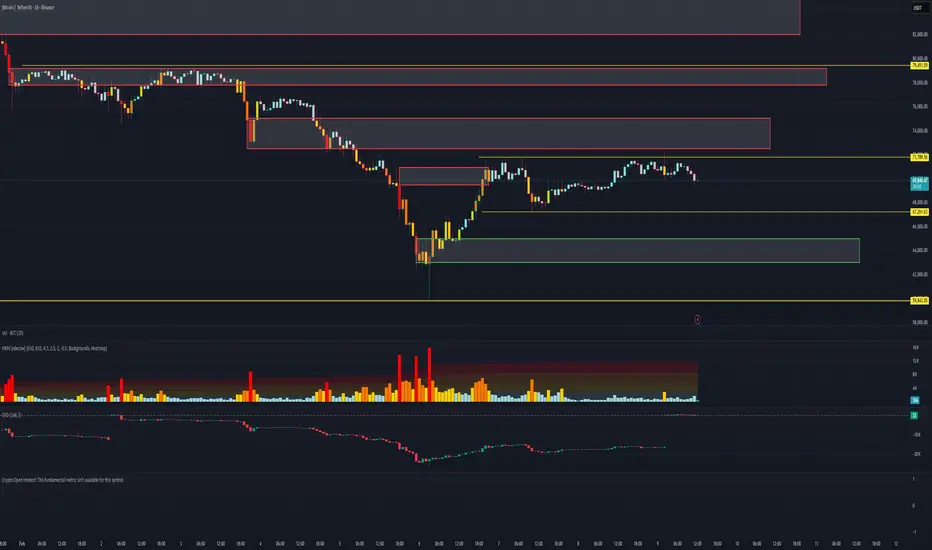
Last week, the decline in bitcoin continued. The sales culminated on Friday, February 6: the price reached a local low around $60,000, followed by a rebound.
During the decline, there were significant volumes from sellers. The increased density of sales persisted up to the level of $ 71,000, where the first resistance formed. During the correction, delta sales were absorbed. As a result, the current market structure increasingly resembles a local sideways trend.
WHAT WILL HAPPEN: OR NOT?
At the moment, volumes have decreased, and the sales area is located higher. The main scenario remains the possibility of a decline with a test of the nearest level, where buyer activity was previously observed at $67,300. Buys can be considered if there is a false breakdown of this level or if the zone of interest of buyers is tested below the range of $65,000-$63,000, where maximum volumes were recorded.
The overall market structure remains ambiguous. On the one hand, a steady consolidation above $71,000 on the 4H timeframe will allow us to consider the accumulated volumes as the basis for long positions. On the other hand, the daily timeframe indicates a continuing downward trend that may develop further.
Buy zones
$65,000–$63,000 (maximum traded volumes)
$72,200–$56,000 (daily buy zone)
Sell zones
$72,500–$75,200 (selling pressure)
$77,800–$79,200 (accumulated volumes)
$82,000–$85,500 (volume anomalies)
$87,600–$90,500 (accumulated volumes)
IMPORTANT DATES
We’re following these macroeconomic developments this week:
• Tuesday, February 10, 13:30 (UTC) — publication of the volume and the basic index of US retail sales for December;
• Wednesday, February 11, 13:30 (UTC) — publication of the average hourly wage, changes in the number of people employed in the non-agricultural sector, as well as the unemployment rate in the United States in January;
• Wednesday, February 12, 7:00 (UTC) — publication of UK GDP for the fourth quarter of 2025 and for December;
• Wednesday, February 12, 13:30 (UTC) — publication of the number of initial applications for unemployment benefits in the United States;
• Wednesday, February 12, 15:00 (UTC) — publication of data on sales in the US secondary housing market for January;
• Friday, February 13, 13:30 (UTC) — publication of the US consumer price index for January.
*This post is not a financial recommendation. Make decisions based on your own experience.
#analytics
Last week, the decline in bitcoin continued. The sales culminated on Friday, February 6: the price reached a local low around $60,000, followed by a rebound.
During the decline, there were significant volumes from sellers. The increased density of sales persisted up to the level of $ 71,000, where the first resistance formed. During the correction, delta sales were absorbed. As a result, the current market structure increasingly resembles a local sideways trend.
WHAT WILL HAPPEN: OR NOT?
At the moment, volumes have decreased, and the sales area is located higher. The main scenario remains the possibility of a decline with a test of the nearest level, where buyer activity was previously observed at $67,300. Buys can be considered if there is a false breakdown of this level or if the zone of interest of buyers is tested below the range of $65,000-$63,000, where maximum volumes were recorded.
The overall market structure remains ambiguous. On the one hand, a steady consolidation above $71,000 on the 4H timeframe will allow us to consider the accumulated volumes as the basis for long positions. On the other hand, the daily timeframe indicates a continuing downward trend that may develop further.
Buy zones
$65,000–$63,000 (maximum traded volumes)
$72,200–$56,000 (daily buy zone)
Sell zones
$72,500–$75,200 (selling pressure)
$77,800–$79,200 (accumulated volumes)
$82,000–$85,500 (volume anomalies)
$87,600–$90,500 (accumulated volumes)
IMPORTANT DATES
We’re following these macroeconomic developments this week:
• Tuesday, February 10, 13:30 (UTC) — publication of the volume and the basic index of US retail sales for December;
• Wednesday, February 11, 13:30 (UTC) — publication of the average hourly wage, changes in the number of people employed in the non-agricultural sector, as well as the unemployment rate in the United States in January;
• Wednesday, February 12, 7:00 (UTC) — publication of UK GDP for the fourth quarter of 2025 and for December;
• Wednesday, February 12, 13:30 (UTC) — publication of the number of initial applications for unemployment benefits in the United States;
• Wednesday, February 12, 15:00 (UTC) — publication of data on sales in the US secondary housing market for January;
• Friday, February 13, 13:30 (UTC) — publication of the US consumer price index for January.
*This post is not a financial recommendation. Make decisions based on your own experience.
#analytics

Unlock your potential in trading
Publications connexes
Clause de non-responsabilité
Les informations et publications ne sont pas destinées à être, et ne constituent pas, des conseils ou recommandations financiers, d'investissement, de trading ou autres fournis ou approuvés par TradingView. Pour en savoir plus, consultez les Conditions d'utilisation.
Unlock your potential in trading
Publications connexes
Clause de non-responsabilité
Les informations et publications ne sont pas destinées à être, et ne constituent pas, des conseils ou recommandations financiers, d'investissement, de trading ou autres fournis ou approuvés par TradingView. Pour en savoir plus, consultez les Conditions d'utilisation.