
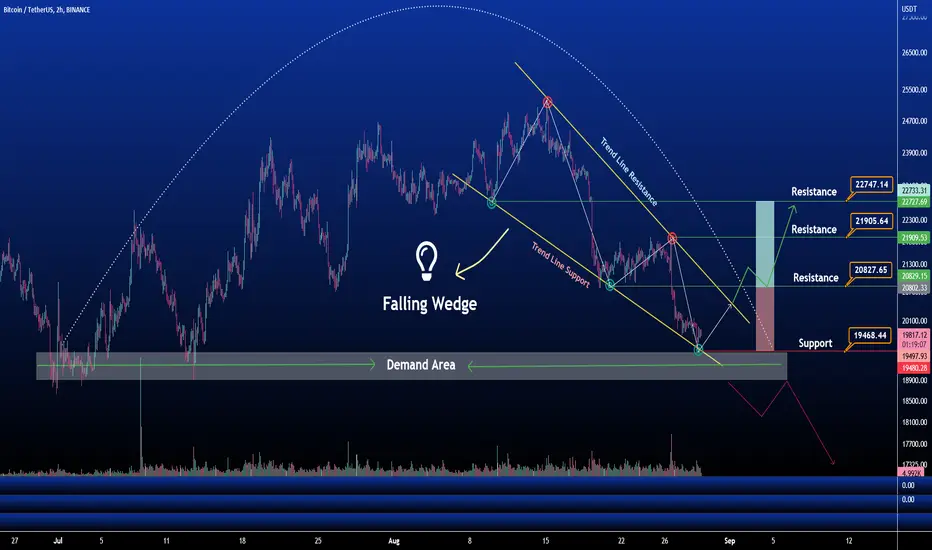
The above chart of Bitcoin (BTC) laid out the falling wedge pattern. In a falling wedge pattern, both the upper trend line which connects the highs and the lower trend line which connects the lows converge downwards. The wedge pattern in general indicates a trend reversal. Especially, the falling wedge signals a bullish reversal.
This pattern indicates a breakout in the price trend towards an upswing. From the above chart, we can interpret that the momentum of the downtrend is slowing down.
Currently, Bitcoin (BTC) is in the range of $19815. If the pattern continues, the price of Bitcoin (BTC) might reach the resistance levels of $22747, If the trend reverses, then the price of Bitcoin (BTC) may fall to $17360
✅Trade Level
Entry Point : $20830
Target : $22747
Stop Loss : $19460
Risk traders can now participate as well.
Happy Trading
Note
Note
Good Move
Publications connexes
Clause de non-responsabilité
Les informations et publications ne sont pas destinées à être, et ne constituent pas, des conseils ou recommandations financiers, d'investissement, de trading ou autres fournis ou approuvés par TradingView. Pour en savoir plus, consultez les Conditions d'utilisation.
Publications connexes
Clause de non-responsabilité
Les informations et publications ne sont pas destinées à être, et ne constituent pas, des conseils ou recommandations financiers, d'investissement, de trading ou autres fournis ou approuvés par TradingView. Pour en savoir plus, consultez les Conditions d'utilisation.