
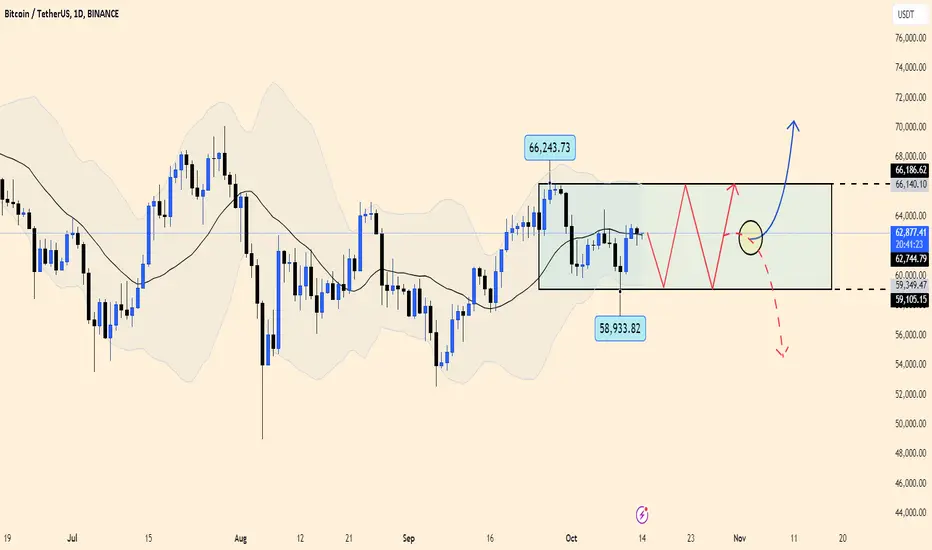
The chart illustrates a sideways movement, with Bitcoin’s price fluctuating within a range defined by the upper and lower bands of the Bollinger Bands. The support and resistance levels are clearly marked around $58,933.82 and $66,186.62, respectively. The price action is constrained between these limits, indicating a lack of momentum and a consolidation phase.
The EMA 34 and 89 are showing weak activity, reflecting the indecisiveness in the market, with no clear signs of a breakout either upwards or downwards. Until the EMAs show a stronger trend signal, the market is likely to remain in this sideways range.
In conclusion, the market is in a consolidation phase, and traders should wait for a breakout from the Bollinger Bands for a clearer direction.
The EMA 34 and 89 are showing weak activity, reflecting the indecisiveness in the market, with no clear signs of a breakout either upwards or downwards. Until the EMAs show a stronger trend signal, the market is likely to remain in this sideways range.
In conclusion, the market is in a consolidation phase, and traders should wait for a breakout from the Bollinger Bands for a clearer direction.

Publications connexes
Clause de non-responsabilité
Les informations et publications ne sont pas destinées à être, et ne constituent pas, des conseils ou recommandations financiers, d'investissement, de trading ou autres fournis ou approuvés par TradingView. Pour en savoir plus, consultez les Conditions d'utilisation.
Publications connexes
Clause de non-responsabilité
Les informations et publications ne sont pas destinées à être, et ne constituent pas, des conseils ou recommandations financiers, d'investissement, de trading ou autres fournis ou approuvés par TradingView. Pour en savoir plus, consultez les Conditions d'utilisation.