
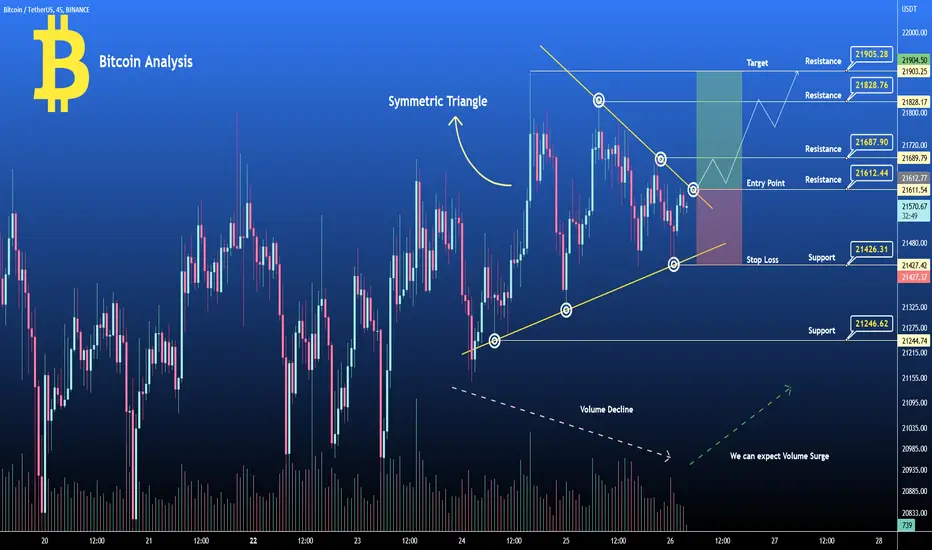
The above chart of Bitcoin ( BTCUSDT ) laid out the Symmetric triangle pattern. Currently, Bitcoin ( BTCUSDT ) is in the range of $21580. If the pattern continues, the price of Bitcoin ( BTCUSDT ) might reach the resistance levels of $21900, If the trend reverses, then the price of Bitcoin ( BTCUSDT ) may fall to $21420
RSI - Below 50
Trade Level
Buy Entry : $21615
Target : $21900
Stop Loss : $21420
Happy Trading $$$$
RSI - Below 50
Trade Level
Buy Entry : $21615
Target : $21900
Stop Loss : $21420
Happy Trading $$$$
Note
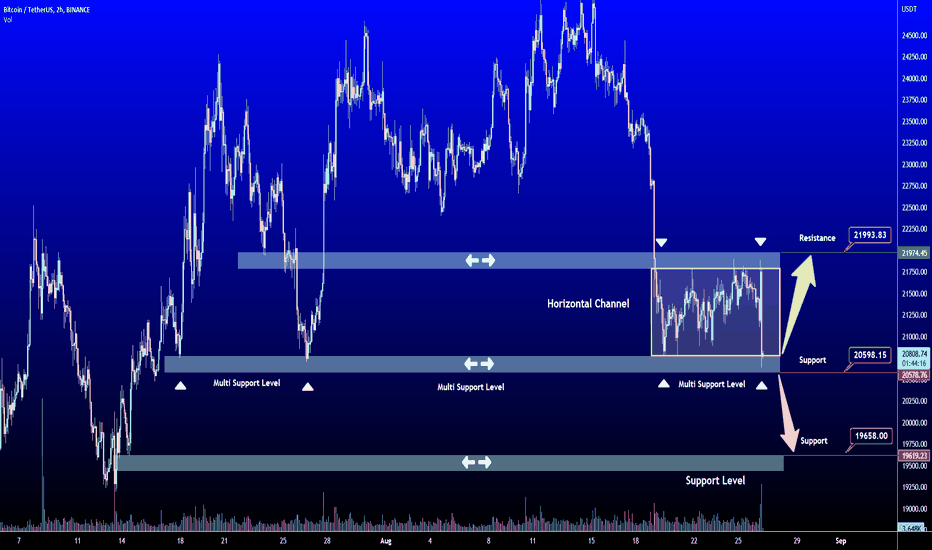
Note
Fresh View Above
Publications connexes
Clause de non-responsabilité
Les informations et publications ne sont pas destinées à être, et ne constituent pas, des conseils ou recommandations financiers, d'investissement, de trading ou autres fournis ou approuvés par TradingView. Pour en savoir plus, consultez les Conditions d'utilisation.
Publications connexes
Clause de non-responsabilité
Les informations et publications ne sont pas destinées à être, et ne constituent pas, des conseils ou recommandations financiers, d'investissement, de trading ou autres fournis ou approuvés par TradingView. Pour en savoir plus, consultez les Conditions d'utilisation.