
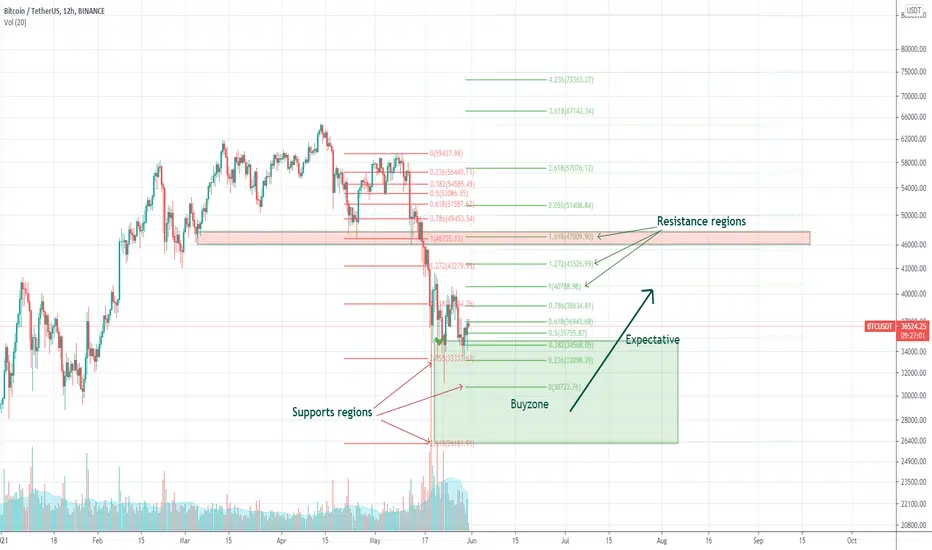
In this chart I mapped support and resistance zones, as bottom in support buy zones are good purchases with a target for a next pullback in the daily.
The buying power of bitcoin is very low, considering that there has been a 50% drop from this historic top, so the chances of bitcoin continuing to fall into the next support zones are relevant.
I continue to buy with only 10% of the capital available for trade, my purchase as previously mentioned was in the region of 35k. I have open orders in the region of 30k and 27k, each with 10% too.
The buying power of bitcoin is very low, considering that there has been a 50% drop from this historic top, so the chances of bitcoin continuing to fall into the next support zones are relevant.
I continue to buy with only 10% of the capital available for trade, my purchase as previously mentioned was in the region of 35k. I have open orders in the region of 30k and 27k, each with 10% too.
Note
I sold previously purchased bitcoins in the 35k region now at 39k.Now I am 100% bear.
Note
I'm keep open buy orders at 29.8k, 28.4k and 26.2k. 10% of my trade capital each order.
Telegram group: t.me/heavensignals
Clause de non-responsabilité
Les informations et publications ne sont pas destinées à être, et ne constituent pas, des conseils ou recommandations financiers, d'investissement, de trading ou autres fournis ou approuvés par TradingView. Pour en savoir plus, consultez les Conditions d'utilisation.
Telegram group: t.me/heavensignals
Clause de non-responsabilité
Les informations et publications ne sont pas destinées à être, et ne constituent pas, des conseils ou recommandations financiers, d'investissement, de trading ou autres fournis ou approuvés par TradingView. Pour en savoir plus, consultez les Conditions d'utilisation.