Long
R-0061 A Cup and Handle Pattern in Cadilla Healthcare
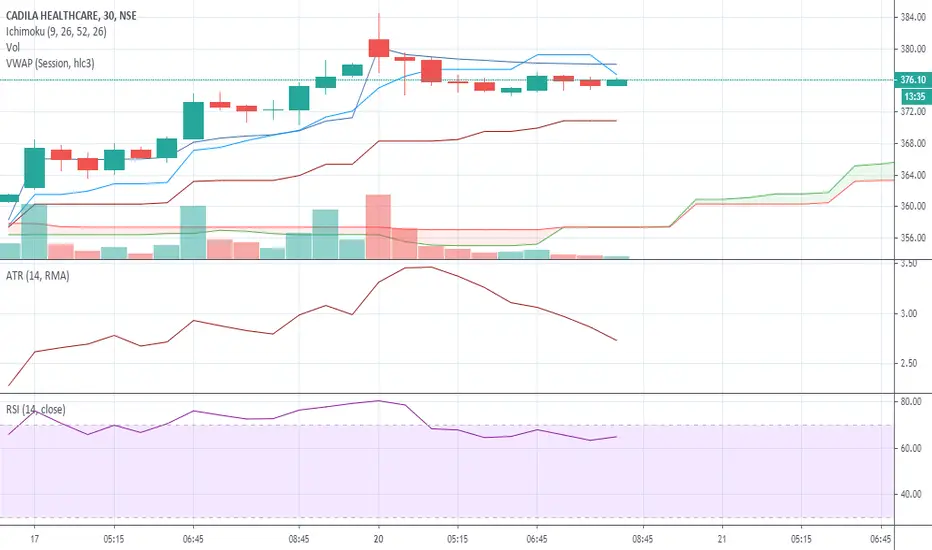
Buy above Rs 381 for a rally to Rs 425 and above that to Rs 470. Keep a stop below Rs 360. Have the willingness to hold this trade for several weeks.
On the weekly time frame (left pane) Cadila Healthcare is showing a pause just below the 50 percent retracement. The MACD oscillator is in a buy mode as weekly trend as shown by MACD histogram is above zero and in trending state. On the daily chart (right pane) we see a very well defined Cup and a handle pattern. Price is breaking out of this pattern. The MACD is giving a buy signal.
On the weekly time frame (left pane) Cadila Healthcare is showing a pause just below the 50 percent retracement. The MACD oscillator is in a buy mode as weekly trend as shown by MACD histogram is above zero and in trending state. On the daily chart (right pane) we see a very well defined Cup and a handle pattern. Price is breaking out of this pattern. The MACD is giving a buy signal.

Clause de non-responsabilité
Les informations et publications ne sont pas destinées à être, et ne constituent pas, des conseils ou recommandations financiers, d'investissement, de trading ou autres fournis ou approuvés par TradingView. Pour en savoir plus, consultez les Conditions d'utilisation.
Clause de non-responsabilité
Les informations et publications ne sont pas destinées à être, et ne constituent pas, des conseils ou recommandations financiers, d'investissement, de trading ou autres fournis ou approuvés par TradingView. Pour en savoir plus, consultez les Conditions d'utilisation.