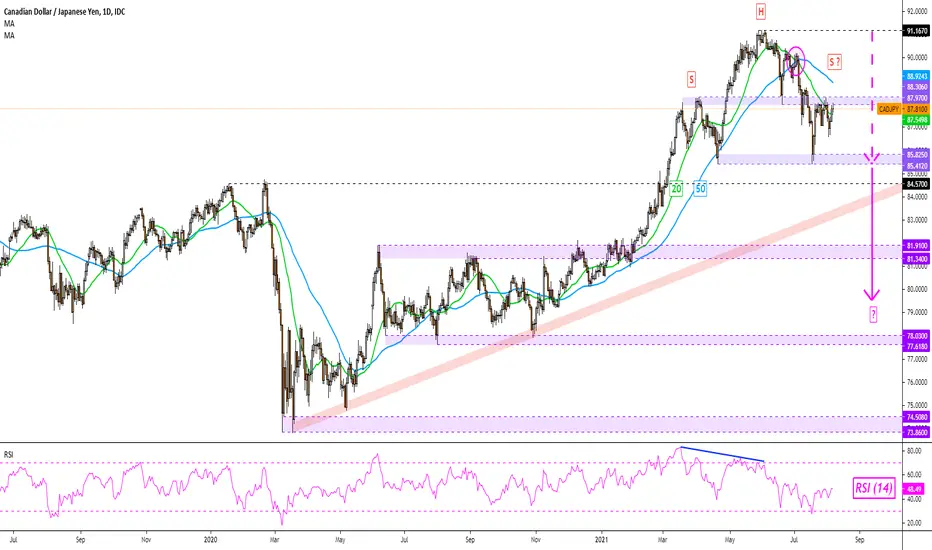
CAD/JPY may be in the process of forming a bearish Head & Shoulders reversal chart pattern.
The right shoulder may complete if prices turn lower on the 88.30 - 87.97 inflection zone, where the left shoulder was created back in March.
If prices turn lower, the neckline seems to be the 85.82 - 85.41 support zone. Breaking under this area could open the door to extending May's top. That would place the focus on rising support from 2020 which could reinstate the dominant upside focus.
Furthermore, a bearish 'Death Cross' between the near-term 20- and 50-day SMAs are underscoring the technical bias to the downside.

 CADJPY
The right shoulder may complete if prices turn lower on the 88.30 - 87.97 inflection zone, where the left shoulder was created back in March.
If prices turn lower, the neckline seems to be the 85.82 - 85.41 support zone. Breaking under this area could open the door to extending May's top. That would place the focus on rising support from 2020 which could reinstate the dominant upside focus.
Furthermore, a bearish 'Death Cross' between the near-term 20- and 50-day SMAs are underscoring the technical bias to the downside.
CADJPY
Clause de non-responsabilité
Les informations et publications ne sont pas destinées à être, et ne constituent pas, des conseils ou recommandations financiers, d'investissement, de trading ou autres fournis ou approuvés par TradingView. Pour en savoir plus, consultez les Conditions d'utilisation.
Clause de non-responsabilité
Les informations et publications ne sont pas destinées à être, et ne constituent pas, des conseils ou recommandations financiers, d'investissement, de trading ou autres fournis ou approuvés par TradingView. Pour en savoir plus, consultez les Conditions d'utilisation.