Long
CAE - Ascending Triangle Breakout + Re-test
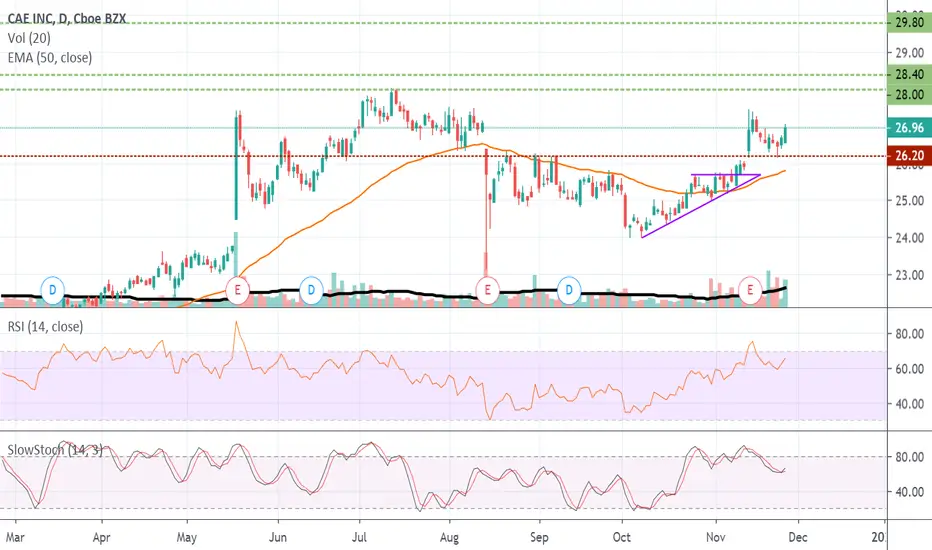
CAE broke out from an Ascending Triangle pattern on November 8th. Since then the price pulled back right to a 50% Fibonacci level where it seems to have found support & is attempting another bullish leg.
I have used the Fibonacci Extension to project three potential price targets at the 50%, 61.8%, & 100% level.
I have used the Fibonacci Extension to project three potential price targets at the 50%, 61.8%, & 100% level.

Clause de non-responsabilité
Les informations et publications ne sont pas destinées à être, et ne constituent pas, des conseils ou recommandations financiers, d'investissement, de trading ou autres fournis ou approuvés par TradingView. Pour en savoir plus, consultez les Conditions d'utilisation.
Clause de non-responsabilité
Les informations et publications ne sont pas destinées à être, et ne constituent pas, des conseils ou recommandations financiers, d'investissement, de trading ou autres fournis ou approuvés par TradingView. Pour en savoir plus, consultez les Conditions d'utilisation.