Long
Cannabiscoin feuling up
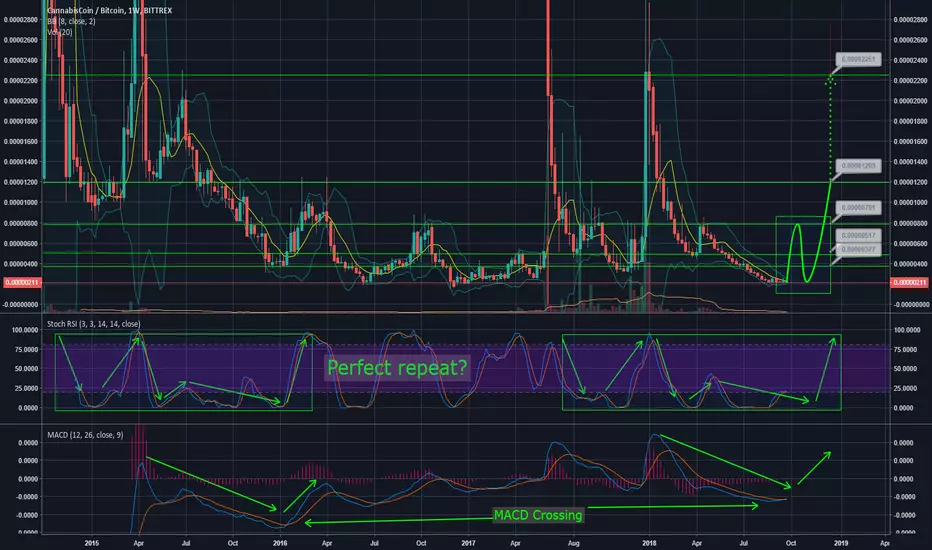
Just started looking at the weekly view and found a repeating pattern in the YTD chart of CANN.
Indicators
Fact
Chart is weekly view, have to give this trade some time to develop.
My Targets:
Mid term
- 377 Sat
- 517 Sat
- 791 Sat
When we look at the history of this coin, big pumps happen, targets (risky) here are:
- 1203
- 2270
- Up to 4500
This is no advice, just my tradesetup an why! DYOR and good luck!
Indicators
- MACD is rising and ready to cross on the weekly chart.
- RSI is making a repeating move to, you can see the repeating pattern in the green rectangles.
Fact
Chart is weekly view, have to give this trade some time to develop.
My Targets:
Mid term
- 377 Sat
- 517 Sat
- 791 Sat
When we look at the history of this coin, big pumps happen, targets (risky) here are:
- 1203
- 2270
- Up to 4500
This is no advice, just my tradesetup an why! DYOR and good luck!

Clause de non-responsabilité
Les informations et publications ne sont pas destinées à être, et ne constituent pas, des conseils ou recommandations financiers, d'investissement, de trading ou autres fournis ou approuvés par TradingView. Pour en savoir plus, consultez les Conditions d'utilisation.
Clause de non-responsabilité
Les informations et publications ne sont pas destinées à être, et ne constituent pas, des conseils ou recommandations financiers, d'investissement, de trading ou autres fournis ou approuvés par TradingView. Pour en savoir plus, consultez les Conditions d'utilisation.