Short
Canopy (CGC) update: 30-60 days downtrend?
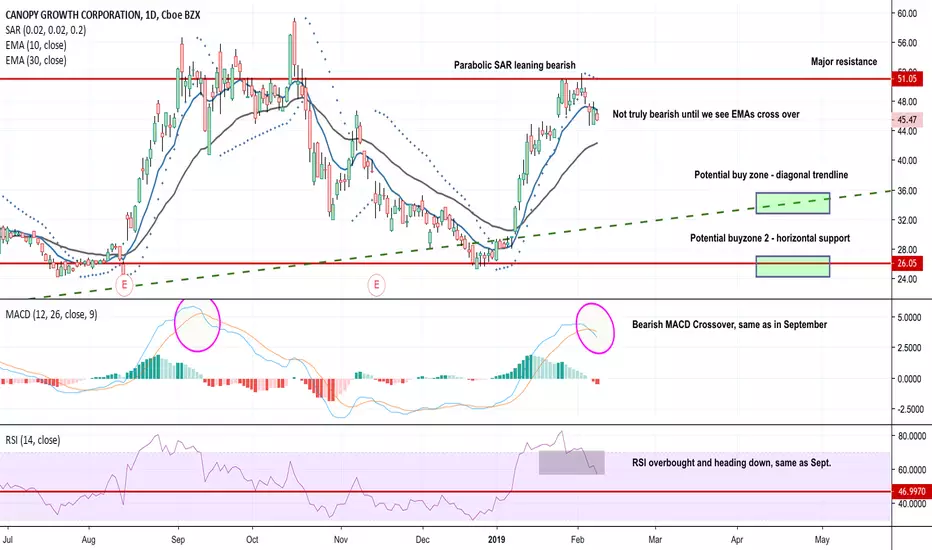
Update of previous chart on Canopy.
MACD, Parabolic Sar, RSI all looking pretty bearish and reminding me of previous chart action in the aftermath of the late 2018 price run-up.
However.. the EMAs (10 and 30) haven't crossed over, and to me that would need to happen to confirm a steep downtrend.
For now things are leaning bearish, if we see further confirmation in that direction, I'd be looking at 30 to 60 days of downtrend based on past price action.
So targeting a buy in March or April - but where would I place my buys?
+ Diagonal trendline
+ Horizontal support
Both of these seem like nice areas to put in some bids. Let's come back and see what happens.
MACD, Parabolic Sar, RSI all looking pretty bearish and reminding me of previous chart action in the aftermath of the late 2018 price run-up.
However.. the EMAs (10 and 30) haven't crossed over, and to me that would need to happen to confirm a steep downtrend.
For now things are leaning bearish, if we see further confirmation in that direction, I'd be looking at 30 to 60 days of downtrend based on past price action.
So targeting a buy in March or April - but where would I place my buys?
+ Diagonal trendline
+ Horizontal support
Both of these seem like nice areas to put in some bids. Let's come back and see what happens.
Note
Update:This is playing out as expected.
Wouldn't be surprised to see a little recovery from the touch of the 30 EMA, then a steady dump from beginning of next week.

Publications connexes
Clause de non-responsabilité
Les informations et publications ne sont pas destinées à être, et ne constituent pas, des conseils ou recommandations financiers, d'investissement, de trading ou autres fournis ou approuvés par TradingView. Pour en savoir plus, consultez les Conditions d'utilisation.
Publications connexes
Clause de non-responsabilité
Les informations et publications ne sont pas destinées à être, et ne constituent pas, des conseils ou recommandations financiers, d'investissement, de trading ou autres fournis ou approuvés par TradingView. Pour en savoir plus, consultez les Conditions d'utilisation.