

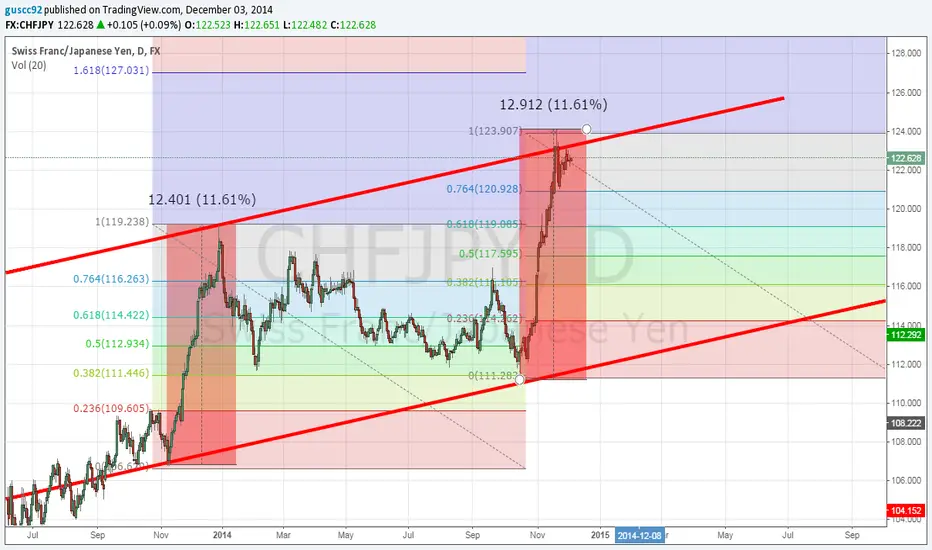
There is a marked long trend tendency with similar resistance and support lines.
Inside that, we can see how the bullish price is strong and has had a retracement of 61.8%.
Both fibonacci are exactly the same, and as we can see, the story seems to repeat.
We can also see how both range have exactly the same % with very similar price unit ranges.
Inside that, we can see how the bullish price is strong and has had a retracement of 61.8%.
Both fibonacci are exactly the same, and as we can see, the story seems to repeat.
We can also see how both range have exactly the same % with very similar price unit ranges.

Clause de non-responsabilité
Les informations et publications ne sont pas destinées à être, et ne constituent pas, des conseils ou recommandations financiers, d'investissement, de trading ou autres fournis ou approuvés par TradingView. Pour en savoir plus, consultez les Conditions d'utilisation.
Clause de non-responsabilité
Les informations et publications ne sont pas destinées à être, et ne constituent pas, des conseils ou recommandations financiers, d'investissement, de trading ou autres fournis ou approuvés par TradingView. Pour en savoir plus, consultez les Conditions d'utilisation.