

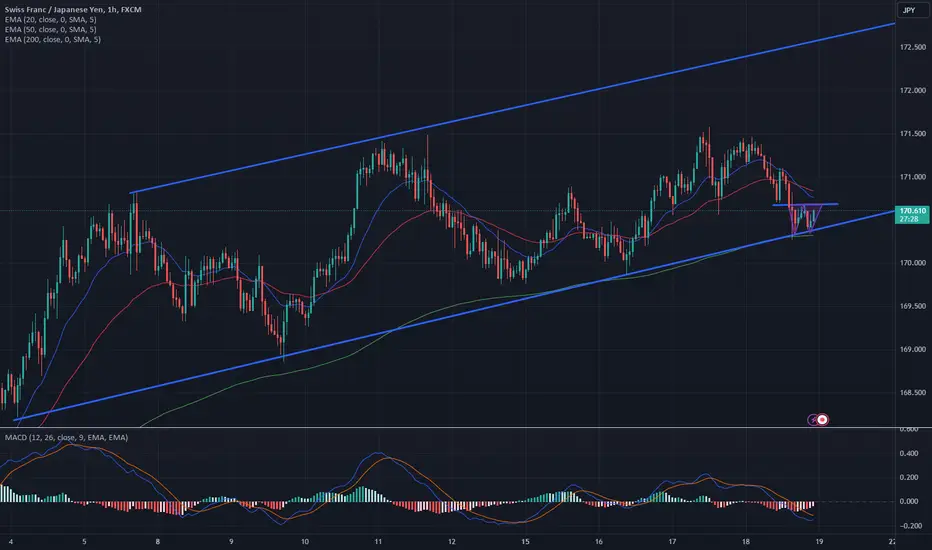
On this 1H chart for CHFJPY we can notice that the price has been moving in an up trend channel for a while now. Recently it dropped to test the up trend support. At this stage the price is forming a potential double bottom. Monitor it for a potential breakout.
Additional confluences:
- MACD can produce a bullish cross if the price starts going up to complete the Double bottom
- The 2 bottoms are re-bouncing from the 200 EMA
- If the price goes up, in can cross above the 20 and 50 EMAs. Monitor for a bullish cross
Additional confluences:
- MACD can produce a bullish cross if the price starts going up to complete the Double bottom
- The 2 bottoms are re-bouncing from the 200 EMA
- If the price goes up, in can cross above the 20 and 50 EMAs. Monitor for a bullish cross
Trade fermée: cible de profit atteinte
Price went up and reached the rarget of the double bottom pattern. From there it dropped below the general up trend Support of the channel
Website - rtedinvesting.com/
Free Telegram Channel - t.me/rtedinvestingofficialfreechannel
Free Telegram Channel - t.me/rtedinvestingofficialfreechannel
Clause de non-responsabilité
Les informations et publications ne sont pas destinées à être, et ne constituent pas, des conseils ou recommandations financiers, d'investissement, de trading ou autres fournis ou approuvés par TradingView. Pour en savoir plus, consultez les Conditions d'utilisation.
Website - rtedinvesting.com/
Free Telegram Channel - t.me/rtedinvestingofficialfreechannel
Free Telegram Channel - t.me/rtedinvestingofficialfreechannel
Clause de non-responsabilité
Les informations et publications ne sont pas destinées à être, et ne constituent pas, des conseils ou recommandations financiers, d'investissement, de trading ou autres fournis ou approuvés par TradingView. Pour en savoir plus, consultez les Conditions d'utilisation.