
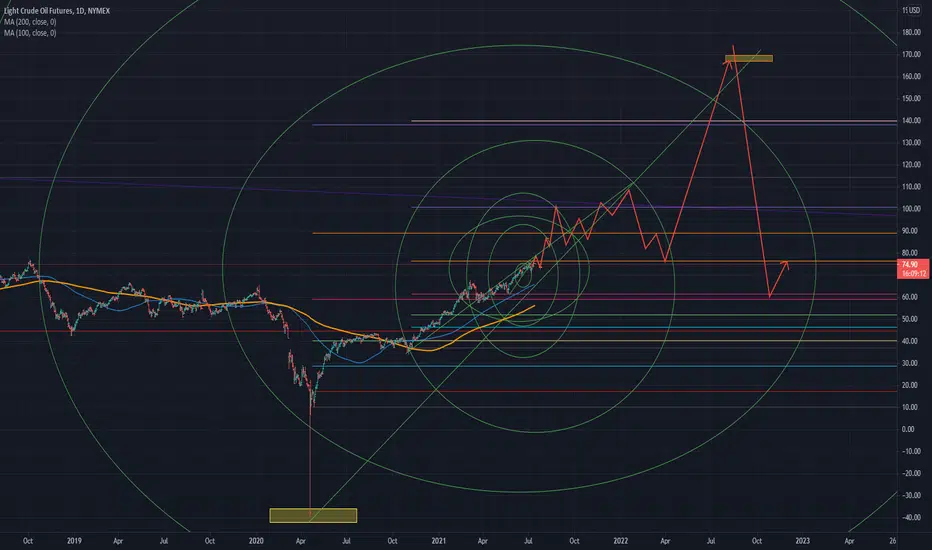
I used Fibonacci circles and used extensions. It is a prediction chart using wave properties. According to this chart, after hitting the $100 range in September of this year and falling, it rises again to $100 in early 2022, and then renews the highest price in 2022 after the decline.
Remember, this is just a personal scenario, not an exact calculation. The choice is yours
Remember, this is just a personal scenario, not an exact calculation. The choice is yours

Clause de non-responsabilité
Les informations et publications ne sont pas destinées à être, et ne constituent pas, des conseils ou recommandations financiers, d'investissement, de trading ou autres fournis ou approuvés par TradingView. Pour en savoir plus, consultez les Conditions d'utilisation.
Clause de non-responsabilité
Les informations et publications ne sont pas destinées à être, et ne constituent pas, des conseils ou recommandations financiers, d'investissement, de trading ou autres fournis ou approuvés par TradingView. Pour en savoir plus, consultez les Conditions d'utilisation.