
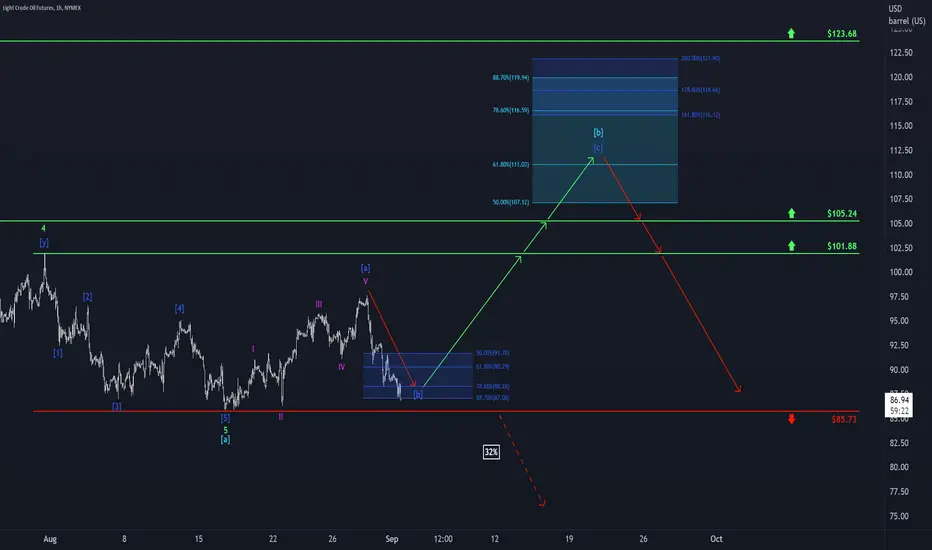
Can you hear WTI’s brakes screeching from the chart? Well, we definitely can! Quite vehemently, WTI has hit the brakes just short of the bottom of the blue zone between $91.70 and $87.08 – and rightly so! There isn’t all that much room left to finish wave b in blue! In fact, WTI should complete it no later than the support at $85.73. Then, it should turn around and climb upwards, gradually crossing the resistances at $101.88 and at $105.24 to enter the turquoise zone between $107.12 and $119.94. There, it should finish wave b in turquoise, before moving downwards again. However, there is a 32% chance that WTI could drop below the support at $85.73, which would then trigger further descent.

📊 Daily market insights combining macro + Elliott Wave analysis
🚀 Spot trends early with momentum, sentiment & price structure
🌐 Join thousands trading smarter at hkcmglobal.com
🚀 Spot trends early with momentum, sentiment & price structure
🌐 Join thousands trading smarter at hkcmglobal.com
Publications connexes
Clause de non-responsabilité
Les informations et publications ne sont pas destinées à être, et ne constituent pas, des conseils ou recommandations financiers, d'investissement, de trading ou autres fournis ou approuvés par TradingView. Pour en savoir plus, consultez les Conditions d'utilisation.
📊 Daily market insights combining macro + Elliott Wave analysis
🚀 Spot trends early with momentum, sentiment & price structure
🌐 Join thousands trading smarter at hkcmglobal.com
🚀 Spot trends early with momentum, sentiment & price structure
🌐 Join thousands trading smarter at hkcmglobal.com
Publications connexes
Clause de non-responsabilité
Les informations et publications ne sont pas destinées à être, et ne constituent pas, des conseils ou recommandations financiers, d'investissement, de trading ou autres fournis ou approuvés par TradingView. Pour en savoir plus, consultez les Conditions d'utilisation.