
hi Readers,
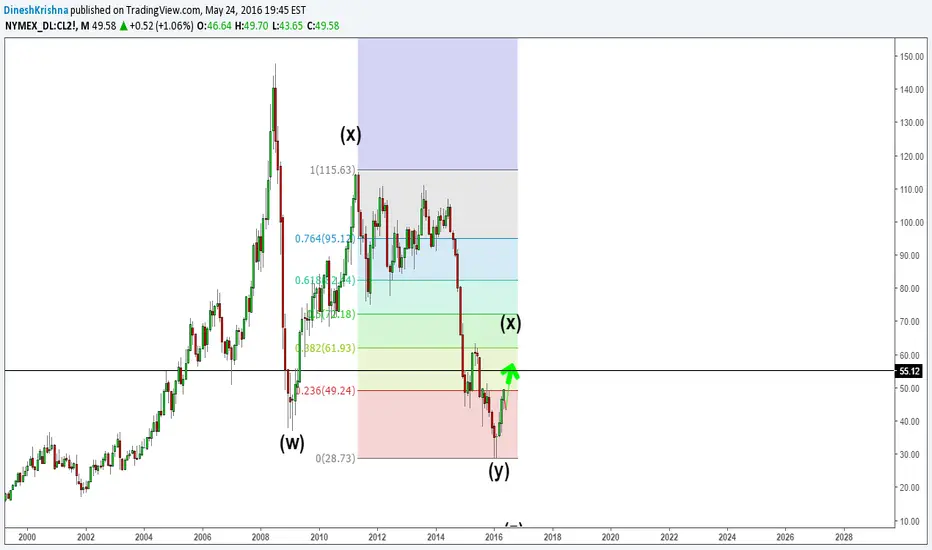
The Chart deals with weekly time Frame
As we now Know that the wave Y in Grand Super Cycle degree & hence the initiation of X wave after Y has pushed it to new highs, say to the current levels. The important idea is that the W within the current X wave in one lesser degree has been progressing as w,x,y,x & z within which waves W,X & Y are completed. so , after an intermediate downtrend for completing the X wave, the market resumes its upper trend to the areas of 55.12 $
For analysis below this degree, that is on daily time frame click here,mytradingcourses.com/
Thanks for reading
Feel free to contact us in need of any assistance
Happy Trading
Dinesh -senior Technical analyst
LeadBrains FSL - mytradingcourses.com Trading education & training firm

Publications connexes
Clause de non-responsabilité
Les informations et publications ne sont pas destinées à être, et ne constituent pas, des conseils ou recommandations financiers, d'investissement, de trading ou autres fournis ou approuvés par TradingView. Pour en savoir plus, consultez les Conditions d'utilisation.
Publications connexes
Clause de non-responsabilité
Les informations et publications ne sont pas destinées à être, et ne constituent pas, des conseils ou recommandations financiers, d'investissement, de trading ou autres fournis ou approuvés par TradingView. Pour en savoir plus, consultez les Conditions d'utilisation.