
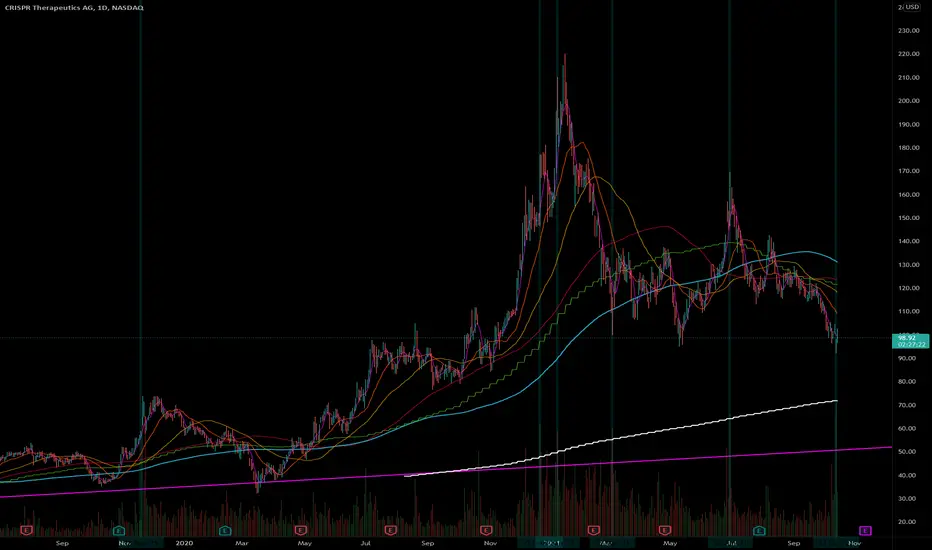
This is a daily chart of CRSP. As you can see, I marked the areas where high volume has occurred in the past. It's a little hard to see as I had to make the vertical lines almost transparent so you could see the candle and the volume I marked.
In every recent case a high volume daily candle has marked a trend change. This may not be the case now, but from the looks of it, it would hard to be short after the bulls stepping up like this during a down trend.
In every recent case a high volume daily candle has marked a trend change. This may not be the case now, but from the looks of it, it would hard to be short after the bulls stepping up like this during a down trend.

My goal is to find the best risk:reward setups. For instance, if you risk $1,000 at a chance to make $5,000, you can afford to be wrong 4 out of 5 times and still not lose money. I hit my targets over 50% of the time.
Clause de non-responsabilité
Les informations et publications ne sont pas destinées à être, et ne constituent pas, des conseils ou recommandations financiers, d'investissement, de trading ou autres fournis ou approuvés par TradingView. Pour en savoir plus, consultez les Conditions d'utilisation.
My goal is to find the best risk:reward setups. For instance, if you risk $1,000 at a chance to make $5,000, you can afford to be wrong 4 out of 5 times and still not lose money. I hit my targets over 50% of the time.
Clause de non-responsabilité
Les informations et publications ne sont pas destinées à être, et ne constituent pas, des conseils ou recommandations financiers, d'investissement, de trading ou autres fournis ou approuvés par TradingView. Pour en savoir plus, consultez les Conditions d'utilisation.