CS Group - CSGN
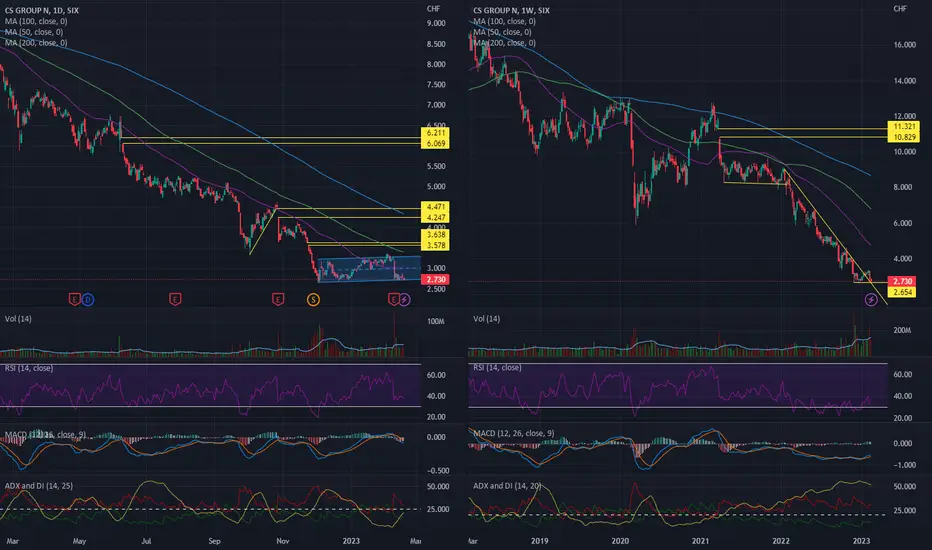
• Slightly upside corridor since beginning December 2022 (daily chart on the left side)
• The stock is currently trading at the bottom of the corridor (left side chart)
• Low volume in the last days (left side chart)
• Break out of the decreasing trend line in the last weeks (weekly chart on the right side)
• Supportline at 2.654 (right side chart)
• MACD line crossed the MACD Signal upward, which supports the outbreak of the decreasing trendline (right side chart)
• Stay neutral and wait if the support will hold
• The stock is currently trading at the bottom of the corridor (left side chart)
• Low volume in the last days (left side chart)
• Break out of the decreasing trend line in the last weeks (weekly chart on the right side)
• Supportline at 2.654 (right side chart)
• MACD line crossed the MACD Signal upward, which supports the outbreak of the decreasing trendline (right side chart)
• Stay neutral and wait if the support will hold

Clause de non-responsabilité
Les informations et publications ne sont pas destinées à être, et ne constituent pas, des conseils ou recommandations financiers, d'investissement, de trading ou autres fournis ou approuvés par TradingView. Pour en savoir plus, consultez les Conditions d'utilisation.
Clause de non-responsabilité
Les informations et publications ne sont pas destinées à être, et ne constituent pas, des conseils ou recommandations financiers, d'investissement, de trading ou autres fournis ou approuvés par TradingView. Pour en savoir plus, consultez les Conditions d'utilisation.