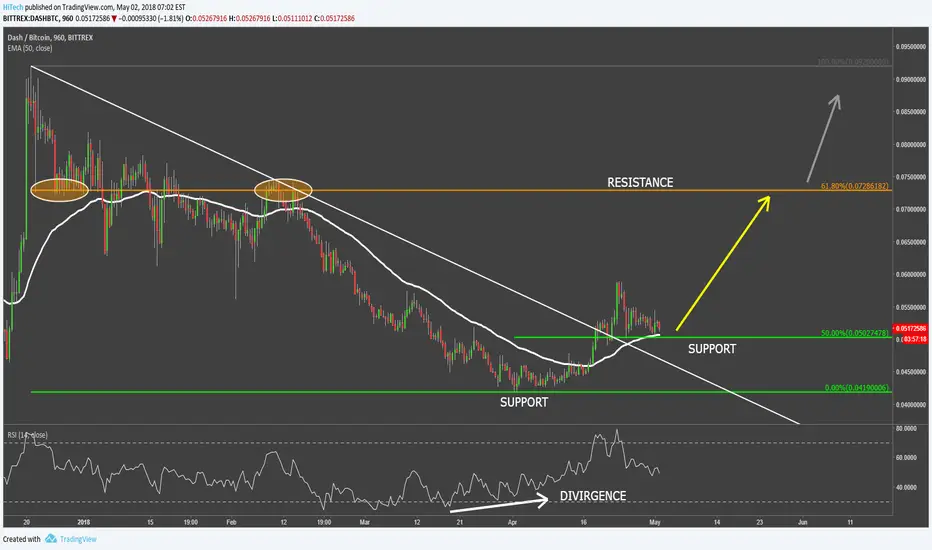
After Dash has found the bottom at btc 0.042, RSI oscillator has formed a bullish divergence and price has started to move up. DASH/BTC broke above the 50 Moving Average and then above the downtrend trendline, suggesting trend reversal.
Dash has reached the high at btc 0.059 and corrected down to btc 0.05, where it found the support at 50% Fibonacci retracement level and 50 Moving Average. The support has been rejected so fart and it looks like an interesting timing as from this point onward price could continue moving higher.
The next upside target is seen near 61.8% Fibonacci retracement area, that is btc 0.072. Previously price found the support and then resistance at the very same level. Break above that resistance could send price much higher while rejection should result in a strong corrective move down.
On the downside, break and close below the current support, that is btc 0.05, could send price down to btc 0.04 support to form a double bottom.
Dash has reached the high at btc 0.059 and corrected down to btc 0.05, where it found the support at 50% Fibonacci retracement level and 50 Moving Average. The support has been rejected so fart and it looks like an interesting timing as from this point onward price could continue moving higher.
The next upside target is seen near 61.8% Fibonacci retracement area, that is btc 0.072. Previously price found the support and then resistance at the very same level. Break above that resistance could send price much higher while rejection should result in a strong corrective move down.
On the downside, break and close below the current support, that is btc 0.05, could send price down to btc 0.04 support to form a double bottom.

Clause de non-responsabilité
Les informations et publications ne sont pas destinées à être, et ne constituent pas, des conseils ou recommandations financiers, d'investissement, de trading ou autres fournis ou approuvés par TradingView. Pour en savoir plus, consultez les Conditions d'utilisation.
Clause de non-responsabilité
Les informations et publications ne sont pas destinées à être, et ne constituent pas, des conseils ou recommandations financiers, d'investissement, de trading ou autres fournis ou approuvés par TradingView. Pour en savoir plus, consultez les Conditions d'utilisation.