
DATAMATICS – Symmetrical Triangle Breakout Watch on Weekly Chart
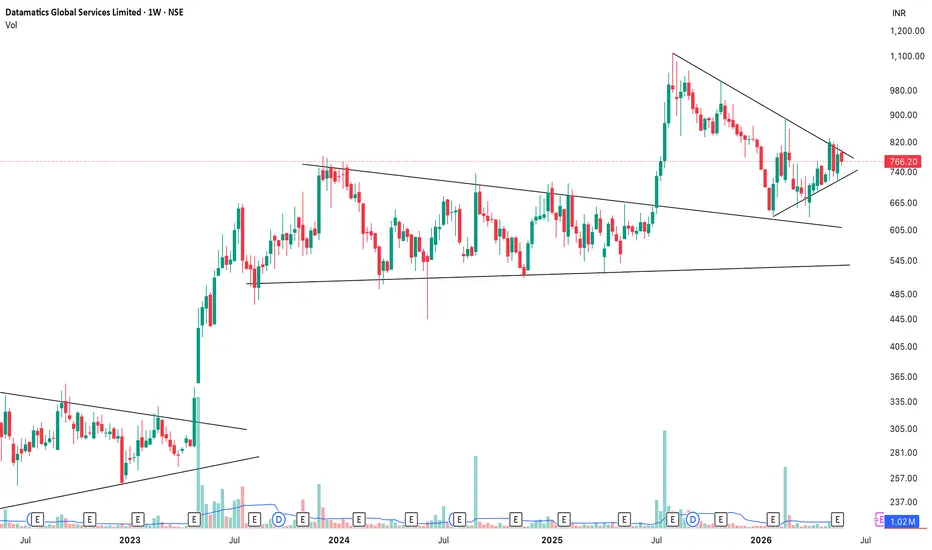
📈 Stock: DATAMATICS (Datamatics Global Services Ltd.)
Observation:
The stock is currently consolidating within a symmetrical triangle pattern on the weekly timeframe after a strong impulsive move. Price action is tightening near the apex, indicating a potential breakout setup in the coming weeks.
Technical Factors:
✔ Symmetrical Triangle Formation
✔ Price Consolidation Near Resistance
✔ Strong Historical Momentum
✔ Volume Monitoring For Confirmation
Key Levels:
• Resistance Zone: Triangle upper trendline
• Support Zone: Triangle lower trendline
• Breakout Confirmation: Sustained move above resistance with volume
• Breakdown Risk: Close below support trendline
Expectation:
Keeping DATAMATICS on watch as price approaches a decisive zone. A breakout with volume confirmation may lead to momentum continuation, while rejection could result in further consolidation.
What are your views on this setup?
What are your views on this setup?
📌 Follow @thebreakout.lab for more educational breakout setups, technical analysis, and high-quality chart studies.
If you found this analysis useful, don’t forget to like, boost, and follow for more market insights.
⚠ Disclaimer:
Stock analysis posted here is for educational purposes only. We encourage you to do your own analysis before taking any trade, this is not a recommendation to buy or sell.
We are not SEBI Registered Advisors. We shall not be responsible for your profit or loss. Please confirm with your investment advisor.
Observation:
The stock is currently consolidating within a symmetrical triangle pattern on the weekly timeframe after a strong impulsive move. Price action is tightening near the apex, indicating a potential breakout setup in the coming weeks.
Technical Factors:
✔ Symmetrical Triangle Formation
✔ Price Consolidation Near Resistance
✔ Strong Historical Momentum
✔ Volume Monitoring For Confirmation
Key Levels:
• Resistance Zone: Triangle upper trendline
• Support Zone: Triangle lower trendline
• Breakout Confirmation: Sustained move above resistance with volume
• Breakdown Risk: Close below support trendline
Expectation:
Keeping DATAMATICS on watch as price approaches a decisive zone. A breakout with volume confirmation may lead to momentum continuation, while rejection could result in further consolidation.
What are your views on this setup?
What are your views on this setup?
📌 Follow @thebreakout.lab for more educational breakout setups, technical analysis, and high-quality chart studies.
If you found this analysis useful, don’t forget to like, boost, and follow for more market insights.
⚠ Disclaimer:
Stock analysis posted here is for educational purposes only. We encourage you to do your own analysis before taking any trade, this is not a recommendation to buy or sell.
We are not SEBI Registered Advisors. We shall not be responsible for your profit or loss. Please confirm with your investment advisor.

Clause de non-responsabilité
Les informations et publications ne sont pas destinées à être, et ne constituent pas, des conseils ou recommandations financiers, d'investissement, de trading ou autres fournis ou approuvés par TradingView. Pour en savoir plus, consultez les Conditions d'utilisation.
Clause de non-responsabilité
Les informations et publications ne sont pas destinées à être, et ne constituent pas, des conseils ou recommandations financiers, d'investissement, de trading ou autres fournis ou approuvés par TradingView. Pour en savoir plus, consultez les Conditions d'utilisation.