
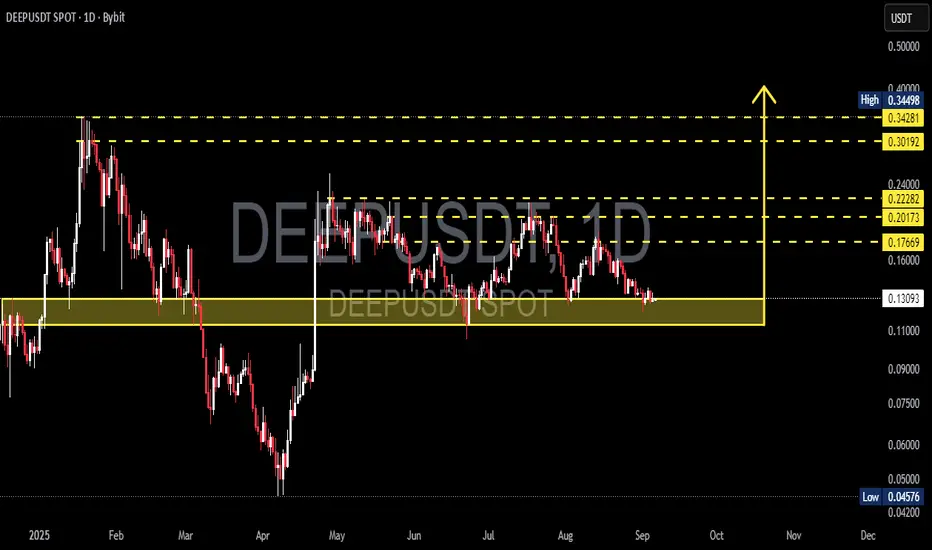
Currently, DEEP/USDT is testing a major support area around 0.110 – 0.131 USDT (yellow box). This zone has acted as a strong demand level several times in the past, making it the key decision point: will price rebound toward higher resistance levels, or will it break down and extend the bearish trend?
---
🔹 Price Structure & Pattern
Earlier this year, DEEP reached a high of 0.34498 before facing a sharp correction.
Since May, the chart has been moving in a sideways range, but with a clear pattern of lower highs — showing ongoing selling pressure.
The yellow box (0.110 – 0.131) represents the main demand/support zone. Whether price holds or breaks this zone will define the next major move.
---
✅ Bullish Scenario
If the support holds and price bounces:
Step-by-step upside targets:
1. 0.1767 → +35%
2. 0.2017 → +54%
3. 0.2228 → +70%
4. 0.3019 – 0.3428 → +130% from current levels
Bullish confirmation: a reversal candle (bullish engulfing / pin bar) with strong volume, or a daily close above 0.1767.
Strategy: Enter near support with a conservative SL below 0.095 to avoid fakeouts.
---
❌ Bearish Scenario
If support fails and the daily close drops below 0.110:
Immediate downside target: 0.0900
Extended breakdown may push price toward the 0.0457 major low.
Bearish confirmation: strong daily close below the yellow zone with high selling volume.
---
🎯 Conclusion
DEEP is at a make-or-break level. A rebound from support could trigger a rally of over +100%, while a breakdown might lead to a retest of its historical lows. Traders should wait for clear confirmation (candle + volume) before entering. Always apply strict risk management and avoid impulsive trades.
---
#DEEPUSDT #Altcoin #CryptoAnalysis #PriceAction #SupportResistance #TechnicalAnalysis #CryptoTrading
---
🔹 Price Structure & Pattern
Earlier this year, DEEP reached a high of 0.34498 before facing a sharp correction.
Since May, the chart has been moving in a sideways range, but with a clear pattern of lower highs — showing ongoing selling pressure.
The yellow box (0.110 – 0.131) represents the main demand/support zone. Whether price holds or breaks this zone will define the next major move.
---
✅ Bullish Scenario
If the support holds and price bounces:
Step-by-step upside targets:
1. 0.1767 → +35%
2. 0.2017 → +54%
3. 0.2228 → +70%
4. 0.3019 – 0.3428 → +130% from current levels
Bullish confirmation: a reversal candle (bullish engulfing / pin bar) with strong volume, or a daily close above 0.1767.
Strategy: Enter near support with a conservative SL below 0.095 to avoid fakeouts.
---
❌ Bearish Scenario
If support fails and the daily close drops below 0.110:
Immediate downside target: 0.0900
Extended breakdown may push price toward the 0.0457 major low.
Bearish confirmation: strong daily close below the yellow zone with high selling volume.
---
🎯 Conclusion
DEEP is at a make-or-break level. A rebound from support could trigger a rally of over +100%, while a breakdown might lead to a retest of its historical lows. Traders should wait for clear confirmation (candle + volume) before entering. Always apply strict risk management and avoid impulsive trades.
---
#DEEPUSDT #Altcoin #CryptoAnalysis #PriceAction #SupportResistance #TechnicalAnalysis #CryptoTrading

✅ Get Free Signals! Join Our Telegram Channel Here: t.me/TheCryptoNuclear
✅ Twitter: twitter.com/crypto_nuclear
✅ Join Bybit : partner.bybit.com/b/nuclearvip
✅ Benefits : Lifetime Trading Fee Discount -50%
✅ Twitter: twitter.com/crypto_nuclear
✅ Join Bybit : partner.bybit.com/b/nuclearvip
✅ Benefits : Lifetime Trading Fee Discount -50%
Clause de non-responsabilité
Les informations et publications ne sont pas destinées à être, et ne constituent pas, des conseils ou recommandations financiers, d'investissement, de trading ou autres fournis ou approuvés par TradingView. Pour en savoir plus, consultez les Conditions d'utilisation.
✅ Get Free Signals! Join Our Telegram Channel Here: t.me/TheCryptoNuclear
✅ Twitter: twitter.com/crypto_nuclear
✅ Join Bybit : partner.bybit.com/b/nuclearvip
✅ Benefits : Lifetime Trading Fee Discount -50%
✅ Twitter: twitter.com/crypto_nuclear
✅ Join Bybit : partner.bybit.com/b/nuclearvip
✅ Benefits : Lifetime Trading Fee Discount -50%
Clause de non-responsabilité
Les informations et publications ne sont pas destinées à être, et ne constituent pas, des conseils ou recommandations financiers, d'investissement, de trading ou autres fournis ou approuvés par TradingView. Pour en savoir plus, consultez les Conditions d'utilisation.