Mis à jour
Inverse H&S Formation?
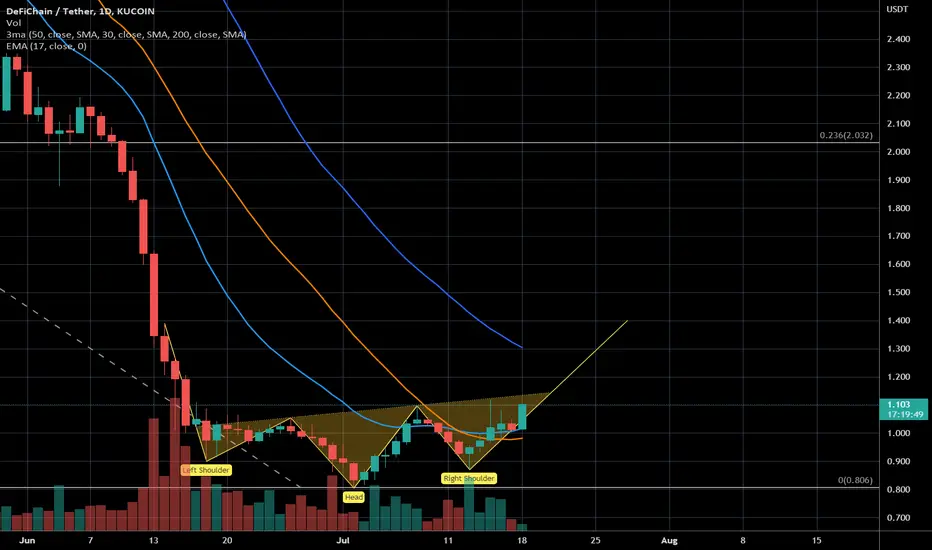
You can see an inverse H&S chart pattern is forming in DFI/USDT. We have broken the EMA 17 and SMA 30 already to the upside - the SMA 50 could offer a bit more resistance at currently 1.30 USD.
For me it seems like the crypto market could reverse (see also the BTC/USD chart) - not to approach the ATHs but to make a first move to the upside. We'll see.
For me it seems like the crypto market could reverse (see also the BTC/USD chart) - not to approach the ATHs but to make a first move to the upside. We'll see.
Note
It was going a bit longer sideways then I've expected - you may extend the right line further to the right. However - it seems that the formation has successfully broken to the upside.
Publications connexes
Clause de non-responsabilité
Les informations et publications ne sont pas destinées à être, et ne constituent pas, des conseils ou recommandations financiers, d'investissement, de trading ou autres fournis ou approuvés par TradingView. Pour en savoir plus, consultez les Conditions d'utilisation.
Publications connexes
Clause de non-responsabilité
Les informations et publications ne sont pas destinées à être, et ne constituent pas, des conseils ou recommandations financiers, d'investissement, de trading ou autres fournis ou approuvés par TradingView. Pour en savoir plus, consultez les Conditions d'utilisation.