
📊 Current Context
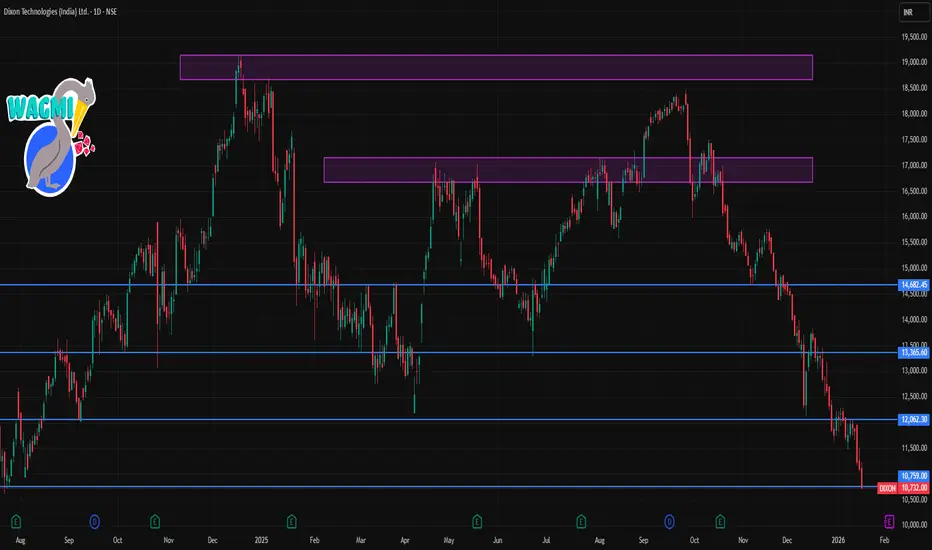
Latest traded price around ₹10,700 – ₹10,750 on NSE (recent price decline)
The stock is trading below major short-term moving averages, indicating short-term bearish bias.
🧠 Daily Pivot‑Based Levels (1‑Day Timeframe)
📈 Resistance (Upside)
R1: ≈ ₹11,401
R2: ≈ ₹11,699
R3: ≈ ₹11,872
(Levels from pivot analysis which traders use for intraday S/R monitoring)
📉 Support (Downside)
S1: ≈ ₹10,930
S2: ≈ ₹10,757
S3: ≈ ₹10,459
(Key intraday support zones where buyers may step in)
👉 Pivot (Daily Center): ~ ₹11,228 – above/below this helps judge bullish/bearish pressure.
📌 Short‑Term Technical Signals
RSI in oversold/weak territory — suggests momentum is on the downside and short‑term sellers are in control.
Price trading below 5, 10, 20, 50, 100, 200 SMAs/EMAs — a bearish multi‑MA structure on the daily chart.
Implication: On a 1‑day chart, the trend is weak/sloping lower until price breaks above near‑term resistances.
🧯 Short‑Term Trading Insight
Bearish bias: With price below key averages & oversold momentum, short‑term traders often look for lower‑high rallies to fade rather than long‑only entries.
Watch S1/S2 aggressively: If these fail, next support zones (S2/S3) become focus for intraday pullbacks.
Latest traded price around ₹10,700 – ₹10,750 on NSE (recent price decline)
The stock is trading below major short-term moving averages, indicating short-term bearish bias.
🧠 Daily Pivot‑Based Levels (1‑Day Timeframe)
📈 Resistance (Upside)
R1: ≈ ₹11,401
R2: ≈ ₹11,699
R3: ≈ ₹11,872
(Levels from pivot analysis which traders use for intraday S/R monitoring)
📉 Support (Downside)
S1: ≈ ₹10,930
S2: ≈ ₹10,757
S3: ≈ ₹10,459
(Key intraday support zones where buyers may step in)
👉 Pivot (Daily Center): ~ ₹11,228 – above/below this helps judge bullish/bearish pressure.
📌 Short‑Term Technical Signals
RSI in oversold/weak territory — suggests momentum is on the downside and short‑term sellers are in control.
Price trading below 5, 10, 20, 50, 100, 200 SMAs/EMAs — a bearish multi‑MA structure on the daily chart.
Implication: On a 1‑day chart, the trend is weak/sloping lower until price breaks above near‑term resistances.
🧯 Short‑Term Trading Insight
Bearish bias: With price below key averages & oversold momentum, short‑term traders often look for lower‑high rallies to fade rather than long‑only entries.
Watch S1/S2 aggressively: If these fail, next support zones (S2/S3) become focus for intraday pullbacks.

Contact Knowledgehub for a detailed consultation: Dm on WhatsApp: [wa.link/a2o0kz]-
Phone No: [+91 93102 26243]-
Email: [tradingviewknowledgehub@gmail.com]---
-- Let’s achieve success together!
Phone No: [+91 93102 26243]-
Email: [tradingviewknowledgehub@gmail.com]---
-- Let’s achieve success together!
Publications connexes
Clause de non-responsabilité
Les informations et publications ne sont pas destinées à être, et ne constituent pas, des conseils ou recommandations financiers, d'investissement, de trading ou autres fournis ou approuvés par TradingView. Pour en savoir plus, consultez les Conditions d'utilisation.
Contact Knowledgehub for a detailed consultation: Dm on WhatsApp: [wa.link/a2o0kz]-
Phone No: [+91 93102 26243]-
Email: [tradingviewknowledgehub@gmail.com]---
-- Let’s achieve success together!
Phone No: [+91 93102 26243]-
Email: [tradingviewknowledgehub@gmail.com]---
-- Let’s achieve success together!
Publications connexes
Clause de non-responsabilité
Les informations et publications ne sont pas destinées à être, et ne constituent pas, des conseils ou recommandations financiers, d'investissement, de trading ou autres fournis ou approuvés par TradingView. Pour en savoir plus, consultez les Conditions d'utilisation.