
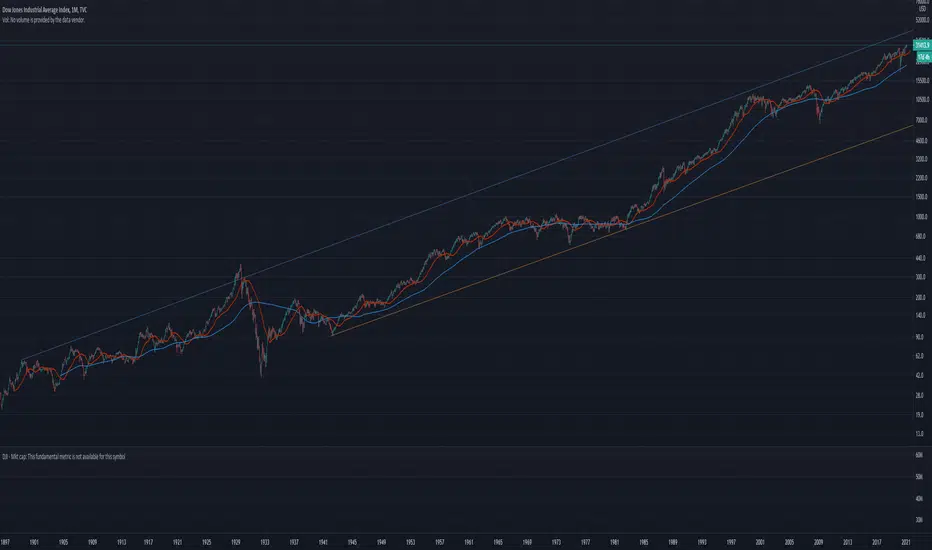
I keep hearing that stocks are in a bubble, but that just isn't true. People always look at charts in a linear mode, but this is not how math works. To get accurate prices and movement we MUST look at a logarithmic chart. When you do this for the Dow Jones average for the last century you clearly see we perhaps are a little inflated, but nowhere near Bubble territory. You want a Bubble? 1929 - now *that* was wildly over valued (with a subsequent epic crash). Now if in 2023 the Dow is above 45k? Then you can get back to me about how we might be in an asset Bubble. Until then I expect the trend to continue bullish.

Clause de non-responsabilité
Les informations et publications ne sont pas destinées à être, et ne constituent pas, des conseils ou recommandations financiers, d'investissement, de trading ou autres fournis ou approuvés par TradingView. Pour en savoir plus, consultez les Conditions d'utilisation.
Clause de non-responsabilité
Les informations et publications ne sont pas destinées à être, et ne constituent pas, des conseils ou recommandations financiers, d'investissement, de trading ou autres fournis ou approuvés par TradingView. Pour en savoir plus, consultez les Conditions d'utilisation.