
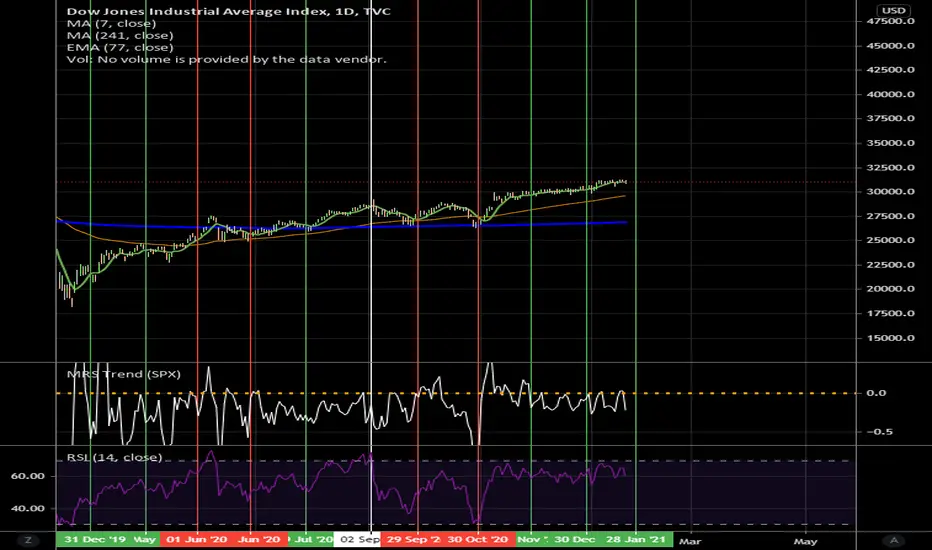
This is an analyzation Yale Hirsch's book "Don't Sell Stocks on Monday" in which he defines stock markets high/low months over the past 100 years.
High Months: January, March, April, July, November December
Low Months: February, May, June, August, September, October
Green Lines mark Positive Correlation with High Months
Red Lines mark Positive Correlation with Low Months
White Lines mark no Correlation for the month.
8 times out of the past 3 years the averages were wrong for an %80 accuracy.
High Months: January, March, April, July, November December
Low Months: February, May, June, August, September, October
Green Lines mark Positive Correlation with High Months
Red Lines mark Positive Correlation with Low Months
White Lines mark no Correlation for the month.
8 times out of the past 3 years the averages were wrong for an %80 accuracy.

Clause de non-responsabilité
Les informations et publications ne sont pas destinées à être, et ne constituent pas, des conseils ou recommandations financiers, d'investissement, de trading ou autres fournis ou approuvés par TradingView. Pour en savoir plus, consultez les Conditions d'utilisation.
Clause de non-responsabilité
Les informations et publications ne sont pas destinées à être, et ne constituent pas, des conseils ou recommandations financiers, d'investissement, de trading ou autres fournis ou approuvés par TradingView. Pour en savoir plus, consultez les Conditions d'utilisation.