
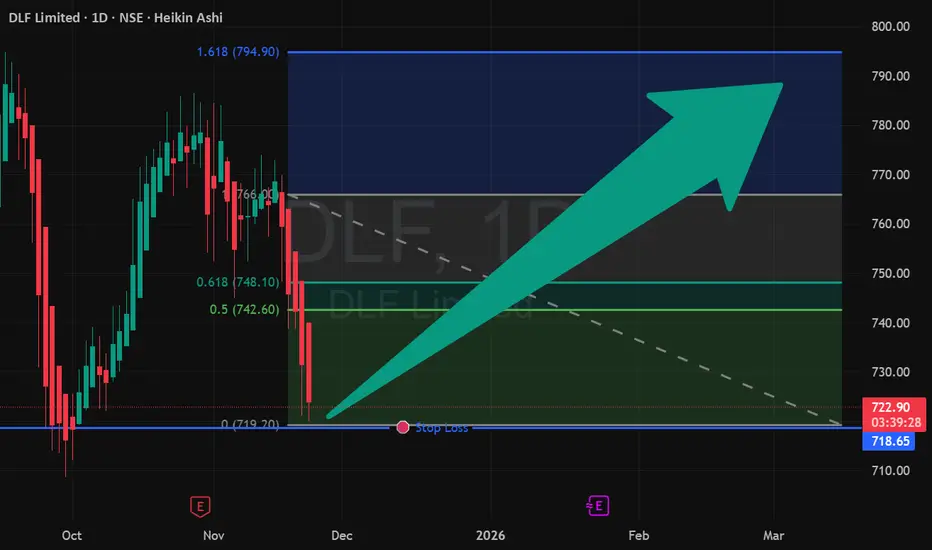
🎯 STRATEGY SNAP: CLASSIC 'W' BOTTOM PATTERN IN ACTION
CHART SETUP:
Stock: DLF (India)
Timeframe: Daily - Ideal for swing identification
Pattern: Bullish 'W' Formation (Double Bottom)
Key Feature: Right-side breakout above neckline
📊 STRATEGY EXECUTION PLAN:
ENTRY ZONE: ₹723 - ₹725
Optimal area for position initiation
Confirmation above pattern neckline
RISK MANAGEMENT:
Stop Loss: ₹715 (Below pattern support)
Risk Per Trade: ~1.4% from entry
Position Sizing: Standard 1-2% portfolio risk
PROFIT TARGETS:
Target 1: ₹740 (+2.1% return)
Target 2: ₹760 (+4.8% return)
Risk-Reward Ratio: 1:2.1 (Very favorable)
🎓 PATTERN EDUCATION - THE 'W' BOTTOM:
Why This Pattern Works:
Double Support Confirmation: Price tested ₹715 level twice and held
Neckline Break: Signal triggers above the W's peak
Volume Confirmation: Ideally should see increasing volume on breakout
Measured Move Projection: Pattern height suggests ₹760 target
Pattern Psychology:
First bottom: Sellers exhaust at support
Middle peak: Bulls attempt recovery
Second bottom: Final test of support confirms reversal
Breakout: Bulls take control above resistance
⚡ MY STRATEGY CRITERIA MET:
✅ Clear chart pattern identified
✅ Defined entry with confirmation
✅ Specific risk management levels
✅ Favorable risk-reward ratio
✅ Logical target projections
TRADE MANAGEMENT SUGGESTIONS:
Consider partial profit booking at Target 1
Trail stop loss to breakeven at Target 1
Let remaining position ride to Target 2
🔔 FOLLOW FOR MORE CHART PATTERN STRATEGIES!
#DLF #ChartPatterns #TechnicalAnalysis #StockMarket #SwingTrading #TradingStrategy #Investing
⚠️ DISCLAIMER: I am not a SEBI registered advisor. This is educational content demonstrating chart pattern analysis. Not a recommendation to buy/sell. Trade at your own risk. Past performance doesn't guarantee future results.
This educational approach positions you as a knowledgeable chart strategist rather than just a signal provider, which is exactly what TradingView Mind appreciates and promotes.
CHART SETUP:
Stock: DLF (India)
Timeframe: Daily - Ideal for swing identification
Pattern: Bullish 'W' Formation (Double Bottom)
Key Feature: Right-side breakout above neckline
📊 STRATEGY EXECUTION PLAN:
ENTRY ZONE: ₹723 - ₹725
Optimal area for position initiation
Confirmation above pattern neckline
RISK MANAGEMENT:
Stop Loss: ₹715 (Below pattern support)
Risk Per Trade: ~1.4% from entry
Position Sizing: Standard 1-2% portfolio risk
PROFIT TARGETS:
Target 1: ₹740 (+2.1% return)
Target 2: ₹760 (+4.8% return)
Risk-Reward Ratio: 1:2.1 (Very favorable)
🎓 PATTERN EDUCATION - THE 'W' BOTTOM:
Why This Pattern Works:
Double Support Confirmation: Price tested ₹715 level twice and held
Neckline Break: Signal triggers above the W's peak
Volume Confirmation: Ideally should see increasing volume on breakout
Measured Move Projection: Pattern height suggests ₹760 target
Pattern Psychology:
First bottom: Sellers exhaust at support
Middle peak: Bulls attempt recovery
Second bottom: Final test of support confirms reversal
Breakout: Bulls take control above resistance
⚡ MY STRATEGY CRITERIA MET:
✅ Clear chart pattern identified
✅ Defined entry with confirmation
✅ Specific risk management levels
✅ Favorable risk-reward ratio
✅ Logical target projections
TRADE MANAGEMENT SUGGESTIONS:
Consider partial profit booking at Target 1
Trail stop loss to breakeven at Target 1
Let remaining position ride to Target 2
🔔 FOLLOW FOR MORE CHART PATTERN STRATEGIES!
#DLF #ChartPatterns #TechnicalAnalysis #StockMarket #SwingTrading #TradingStrategy #Investing
⚠️ DISCLAIMER: I am not a SEBI registered advisor. This is educational content demonstrating chart pattern analysis. Not a recommendation to buy/sell. Trade at your own risk. Past performance doesn't guarantee future results.
This educational approach positions you as a knowledgeable chart strategist rather than just a signal provider, which is exactly what TradingView Mind appreciates and promotes.
Transaction en cours
In the earlier move, DLF hit our Cost-to-Cost level / Stop-Loss, and now the price has again come into a re-entry zone.📌 Re-Entry Zone: 715 – 720
🛡 Stop-Loss: 705
🎯 Target 1: 737
🎯 Target 2: 755
Price structure is stabilizing, and if the re-entry zone holds, a recovery toward higher levels is expected. Follow strict risk management.
Trade fermée: ordre d’arrêt atteint
Our previous setup has been invalidated as the Stop-Loss at 705 has been triggered.🔍 Market View:
Price failed to sustain above the re-entry zone, indicating weakness and loss of momentum. We will wait for a fresh setup before entering again.
📢 Important: Protecting capital is the first priority. Hitting SL is a part of disciplined trading.
Stay updated for the next trade setup! 📊✨

Clause de non-responsabilité
Les informations et publications ne sont pas destinées à être, et ne constituent pas, des conseils ou recommandations financiers, d'investissement, de trading ou autres fournis ou approuvés par TradingView. Pour en savoir plus, consultez les Conditions d'utilisation.
Clause de non-responsabilité
Les informations et publications ne sont pas destinées à être, et ne constituent pas, des conseils ou recommandations financiers, d'investissement, de trading ou autres fournis ou approuvés par TradingView. Pour en savoir plus, consultez les Conditions d'utilisation.