
I saw a really interesting chart from MartyBanks about DoDo, I've linked it in the related ideas.
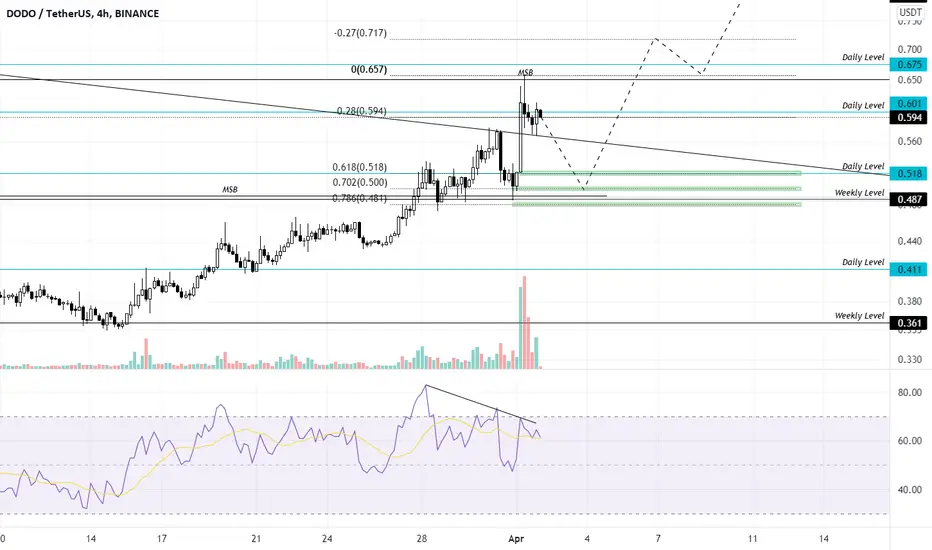
So I decided to look back and chart DoDo. After a massive dump it found support on the weekly level and more recently bouncing from daily support.

From there we had a clear market structure break on the daily. You could make a case and say that we actually had two market structure breaks on the daily timeframe and formed a daily order block at the .489 level. The 9day ema cross of the 21day ema also shows signs of bullishness.
I'm now waiting for a retest to enter. Targets are .518, .500 and .481.
I recommend watching the idea linked to get a better grasp of the situation.
So I decided to look back and chart DoDo. After a massive dump it found support on the weekly level and more recently bouncing from daily support.
From there we had a clear market structure break on the daily. You could make a case and say that we actually had two market structure breaks on the daily timeframe and formed a daily order block at the .489 level. The 9day ema cross of the 21day ema also shows signs of bullishness.
I'm now waiting for a retest to enter. Targets are .518, .500 and .481.
I recommend watching the idea linked to get a better grasp of the situation.

Publications connexes
Clause de non-responsabilité
Les informations et publications ne sont pas destinées à être, et ne constituent pas, des conseils ou recommandations financiers, d'investissement, de trading ou autres fournis ou approuvés par TradingView. Pour en savoir plus, consultez les Conditions d'utilisation.
Publications connexes
Clause de non-responsabilité
Les informations et publications ne sont pas destinées à être, et ne constituent pas, des conseils ou recommandations financiers, d'investissement, de trading ou autres fournis ou approuvés par TradingView. Pour en savoir plus, consultez les Conditions d'utilisation.